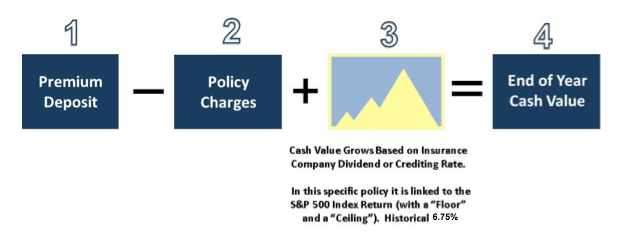
As illustrated in the above flowchart, projections of indexed UL policy performance are based on the forecasting of two variables: (i) annual policy charges; and (ii) the collared return on the index. Each of these is discussed in detail below.
Annual Policy Charges. There are typically four different charges deducted from the cash value of an indexed UL policy. Two of those charges (a premium load charge and a monthly charge per $1,000 of death benefit) are, essentially, sales charges—somewhat analogous to the transaction fees or management fees that one might pay to money managers, brokers, or investment advisors. The premium load charge is assessed each time a premium is paid, while the monthly charge per $1,000 of death benefit is only assessed for the first 10 years after the policy is issued. The third charge is a (generally nominal) annual expense charge. The fourth charge, the monthly cost of insurance per $1,000 of death benefit, is the mortality charge associated with providing the policy’s death benefit—and this is the only charge that is scheduled to increase each year.
Collared Index Return. As described in the text of the flowchart above, the historical average “compound” return on the S&P 500 Index with a 1 percent floor and a 11 percent cap is 6.75 percent. To better explain what this number means, a bit of background is in order. The average annual (uncollared) S&P 500 Index return for all calendar years between 1920 and 2017 was 8.43 percent. It is important to recognize, though, that receiving wildly varying returns that average 8.43 percent per year is not the same as receiving level returns of 8.43 percent each year—and if you had a bank account that was credited with actual S&P 500 Index returns from 1920 to 2017 (excluding dividends), your average compound return would only be 6.57 percent. In other words, volatility reduced the compound return on this investment by 1.86 percent! Now look at the return over the same time period, but with a collar of 1 percent and 11 percent. The average collared return for all calendar years between 1920 and 2017 was 6.90 percent (1.53 percent less than the average return without the collar). However, because the collar dramatically reduces volatility, the average compound return on an account credited with the collared return from 1920 to 2017 would have been 6.80 percent. The collar reduces the impact of volatility from 1.86 percent to only 0.10 percent. (The point of this analysis is not to suggest that the collared return from an Indexed UL policy will outperform direct investment in the S&P 500 (in the long run, it won’t – because direct investors receive dividends in addition to market appreciation), but instead to illustrate how reducing volatility can dramatically improve investment returns.)
At this point in the discussion, any good investment advisor might remind you that past performance is no guarantee of future results—and this is entirely correct. Even if historical averages hold true, the fact that the average return over 98 one-year periods was 6.90 percent does not mean that you will have a return of 6.90 percent in any given one-year period. In any given one-year period, it is not only theoretically possible to realize a return equal to the 1 percent floor, but this is, in fact, what happened in 34 of the 98 one-year periods between 1920 and 2017.
But what if we focus on performance over a 10-year period? There have been 89 rolling 10-year periods between 1920 and 2017 (1920-1929, 1921-1930, 1922-1931, etc.). In this case, while it remains theoretically possible to realize a 10-year average return equal to the 1 percent floor (a result that would require the S&P 500 Index to produce an actual return of 1 percent or less for ten straight years), this never occurred in any of the 89 rolling 10-year periods dating back to 1920. (In fact, since 1920, only once has the S&P 500 Index produced even 4 consecutive years of 1 percent or less [1929-1932], and on only three other occasions has it produced 3 consecutive years of 1 percent or less.) Over the 98 year time frame, the worst rolling 10-year periods (1928-1937, 1929-1938, 1930-1939, 1931-1940, 1932-1941, 1939-1948 and 1969-1978) produced an average return of 5.0 percent, the best rolling 10-year periods (1920-1929 and 1921-1930) produced an average return of 8.4 percent, and the average rolling ten-year period produced an average return of 6.76 percent. As shown in the following chart: A review of all 84 rolling 15-year periods and all 79 rolling 20-year periods yields similar results, with a gradually narrowing bell curve of data points coalescing around a fairly static average number. When you look at more recent history (1980-2017), the averages are higher still.