


Poor countries often accept a dirtier environment as a trade-off for higher incomes. However, economic development eventually changes the cost/benefit calculus in favor of a cleaner environment.
Transitioning from agriculture to manufacturing involves energy-intensive production of basic materials. As incomes grow, people have the willingness and means to demand cleaner production and possess the technical capacity to adopt less polluting methods.
At a later development stage, economies transition from manufacturing to the production and consumption of services, which tend to have a lower carbon footprint.
For these reasons, economists speculate that getting richer could yield cleaner skies and reduce greenhouse gas emissions.
Statistical analyses support this. Analysis of 180 countries since 1950 suggests that carbon emissions per U.S. dollar of GDP peak at around USD18,000 GDP per capita (Thailand and Mexico are typical economies in this income range).
There are roughly 80 countries with a GDP per capita of more than USD18,000 in purchasing power parity terms. However, per capita carbon emissions only peak at around USD68,000 per capita (close to the U.S. level).
This cross-country experience resembles an inverted U-shape curve. The rising and then falling emissions intensity of per-capita GDP raises hopes that global warming may diminish through economic development.

Peak Emissions
For 30 years, researchers have tried to predict when economic development could cause global emissions to fall.
An example is a study this year by Mikkel Bennedsen and colleagues at Aarhus University in Denmark using neural networks to project CO2 emissions based on GDP per capita. Depending on the scenario, this study projects downturns between 2040 and 2060.
These estimates are consistent with other research: economic development will reduce emissions, but not for several decades.
Technological Change
Technological change has slowed emissions, but only in the last two decades. One U.S. dollar of output in 2000 generated 90% more emissions than in 1950. The growth of emissions per GDP started to decline in the 2000s. The 2019 reading is 5% lower than the 2004 peak.
The 50-year rise after 1950 occurred because producers sought lower costs, not lower emissions.

Regulatory changes, higher oil prices, and falling costs of fossil fuel alternatives changed that perspective.
The dramatic OPEC-engineered increase in oil prices in the 1970s and following the September 2001 terrorist attacks in the United States had similar effects, driving down emissions. Policy incentives to move away from fossil fuels have also slowed the rise of output-driven emissions.
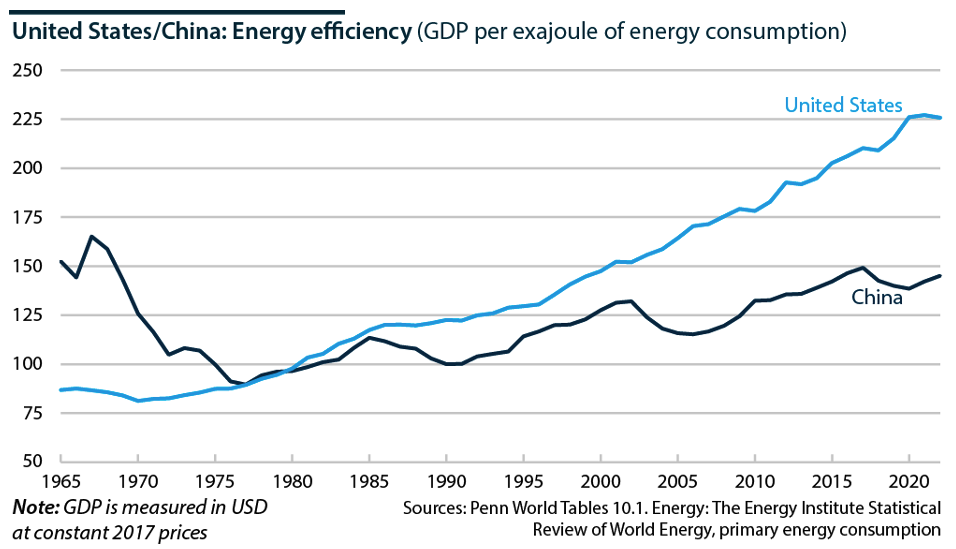
Energy Efficiency
One cause of slowing emissions has been increasing energy efficiency in economic production, illustrated by the Chinese and U.S. experience.
In the 1960s, China was an agricultural society; its subsequent transformation involved massive industrialization that brought hundreds of millions of its people out of poverty. This followed an energy-intensive path underpinned by steel, aluminum, and concrete.
China produced more of these energy-intensive industrial products than the rest of the world combined.
In contrast, the United States was already the most advanced economy in the 1960s, transitioning to a services-based structure. U.S. GDP in 2022 was 50% greater than in 2000, but the economy used the same amount of energy.
The U.S. path also benefited from a shift away from industrial production; although U.S. manufacturing output is greater than ever, it accounts for less than 10% of GDP.
At first, China's transformation from agriculture to heavy industry caused energy efficiency to plunge. A shift to higher efficiency ensued after 1975, when oil prices soared.
As energy efficiency rose, another factor further reduced emissions: lower emissions per unit of energy. China's greenhouse gas emissions per unit of energy output are larger than the United States, but they have declined more sharply, mainly because China is starting from a higher level. Policies, as well as economic forces, guided these reductions.

Developed/Developing Divide
The net result of economic growth, increasing energy efficiency and lower emissions per unit of energy for the United States and China reveals the world's dilemma.
U.S. total emissions are falling while China's continue to rise even though China is the global leader in solar and wind power installation. The global dilemma is that many of the world's largest and fastest-growing economies remain on the rising part of the inverted U-shaped emissions curve versus per-capita GDP; the political dilemma is how to help them move sooner over the top of the curve.