


As a result, these 4 factors (smart betas) are the focus of this paper. Importantly, the characteristics that define the factors will be constructed in a manner as consistent as possible with the original published papers cited in Fama’s survey article. Additionally, the in-sample backtest will be defined by the time period studied in the original published paper. The out-of-sample time period will start in 1992 – the date following Fama’s Efficient Markets Sequel paper publication - through 2015. In my opinion, the degrees of freedom for data mining have been minimized.
Results
For each of the 4 factors (smart betas), the monthly average return is calculated for the in-sample (original publication period) and out-of-sample period (1992- March 2015). Then, the out-of-sample results (actual investor experience) are compared to the in-sample (backtest) results. How much lower (if at all) are the out-of-sample results? The difference between the out-of-sample and in-sample results provides an estimate of the combined data mining and arbitrage effects discussed earlier. In other words, if the out-of-sample results are lower, the original results were partially data mined and/or the original results were real but have been partially arbitraged away since becoming publicly known and available.
The results are reported below. Not surprisingly, all 4 factors have a positive average monthly return during the in-sample period. Now to the key results…what happens during the out-of-sample period, 1992 – 2015? All of the average returns decrease during the out-of-sample period, suggesting that data mining and arbitrage play a material, economically significant role.
Monthly Average Smart Beta Returns: In-Sample vs Out-of-Sample
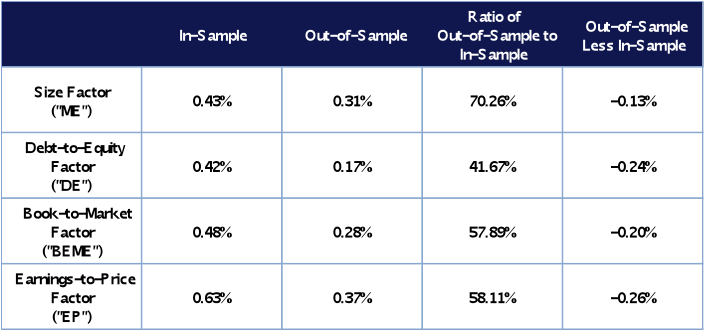
Specifically, on a ratio basis, the out-of-sample average returns tend to be between 42% to 70% of the in-sample results. In other words, the out-of-sample results were 30% (= 100% – 70%) to 58% (= 100% – 42%) lower than the backtests. On an absolute basis, the largest monthly average return reduction occurs for EP, going from 0.63% to 0.37%. The smallest monthly average return reduction occurs for ME, going from 0.43% to 0.31%.
Bottom Line
Smart beta is currently one of the most popular, cutting-edge investment products available today and, in my opinion, is legitimately here to stay in one form or another. As with other investment products, the largest risk confronting investors underwriting smart beta products is what to assume about returns on a prospective basis.
In comparison to other investor products, smart beta products have a few key features that make the returns on a prospective basis issue unique, interesting and potentially problematic. First, there’s a heavy reliance on historical backtesting, which gives investors a sense of clarity – akin to “test driving” the strategy before making an actual investment. However, data mining could taint any backtest. Secondly, unlike the historical backtest time period, the core of the systematic strategies is currently widely known and available in the public domain. As a strategy moves along the life cycle from proprietary/private to public, some portion of the forward-looking return will likely be arbitraged away and, thus, not available to new investors. Not fully appreciating these features can lull investors into a false sense of confidence about future return performance.
So what’s an investor supposed to do beyond critically analyzing the backtest and theory behind the smart beta? Although there’s no elegant solution, the investor needs to “haircut”, i.e. reduce, the backtested performance results when formulating forward looking return assumptions. Assuming the backtest methodology and theory components pass the “sniff test” (a must but not the focus of today’s piece), the haircut could be large and meaningful.
While far from perfect, my ~25 year out-of-sample ratio results suggest a conservative haircut of 58% (= 100% - 42%) when “correcting” the backtested realized average returns. A more optimistic interpretation of the results would reduce the average return haircuts to 30% (= 100% - 70%). Even though there is a range in the magnitude of the conservative and optimistic haircuts, one thing is crystal clear: under both interpretations, the size of the haircut is material. Keep this in mind when underwriting smart beta strategies - good luck!