


|
Insights By
|
|
In brief
• Structural changes – Since the global financial crisis, a number of structural factors have impacted the municipal bond market: The proportion of insured bonds declined significantly, driving a downward quality shift; markets began to differentiate among state and local government issuers based on the funded status of their pensions; and US tax reform created uncertainties in the supply–demand dynamics of the market.
• Index inefficiencies – Municipal bond indices do not adequately cover the investable universe, potentially missing attractive risk-adjusted returns. Additionally, they are weighted towards issuers with large outstanding bond volumes, which could result in high exposure to the more indebted issuers.
• Active management – Active management helps investors to deploy deep credit and legal expertise in order to monitor emerging risks and conduct differentiated analysis of sectors and credits in a broader universe of securities.
Investors have long found a place in their portfolios for municipal bonds, a high-quality asset class that offers tax-advantaged income, low default rates and diversification. While it is possible to invest in passive vehicles that track municipal indices or in the individual bonds themselves, structural changes in the market since the global financial crisis (GFC) and inefficiencies inherent in the indices suggest there are potential benefits to be found in the active management of municipal bonds. This paper explores changes in the municipal market and the characteristics of the indices that argue for this investment approach.
Structural changes
A number of significant structural changes have occurred in the municipal bond market since the GFC.
Decline in insured bonds — Prior to 2008, as much as half of the annual issuance of municipal bonds came to the market insured,1 benefiting from bond insurers' top-notch credit ratings. However, following downgrades due to steep losses on subprime mortgage securities, most bond insurers withdrew from the marketplace while those remaining carry a maximum rating of AA. This drastically reduced usage of insurance in the market; in 2017, only 5% of municipal issuance was insured. Likewise, the proportion of insured bonds in the Bloomberg Barclays Municipal Bond Index declined from almost 46% at the end of 2006 to only 0.24% at the end of 2017. As a result, only 14% of the index was rated AAA at the end of 2017, compared to 69% at the end of 2006.
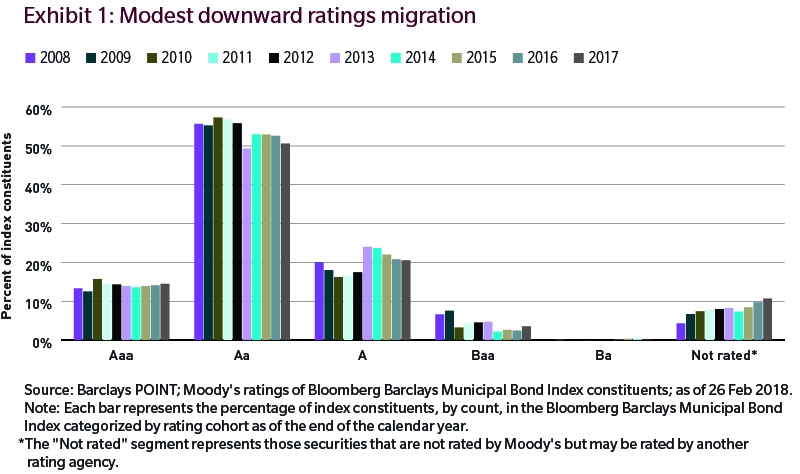
Modest downward ratings migration — Following the decline of insurance usage, municipal bonds remain a high-quality asset class. However, as illustrated in Exhibit 1, there has been modest ratings migration downwards for the Bloomberg Barclays Municipal Bond Index, based on Moody's ratings. At the end of 2008, almost 76% of index constituents were rated Aa or A, with that percentage falling to 71.2% at the end of 2017.
Further, according to a 2017 Moody's study,2 municipal bond defaults of rated securities have increased both in number and volume, i.e., par value, in recent years. Of the 103 defaults since 1970, 45 have occurred since 2007. Specifically, of the 21 general government defaults since 1970, 16 have occurred since 2007. In terms of bond volume, 76% of defaulted bonds are general obligation bonds, mainly from Puerto Rico.
Fiscal pressures on government issuers — General obligation (GO) bonds that are backed by the "full faith and credit" of a state or local government, in particular its taxing authority, have historically been perceived as the gold standard of the municipal market. However, underfunded pension systems are consuming a rising share of the tax revenues that finance core government services, employee benefits and debt repayment. While the majority of state and local governments maintain high-credit quality, reflecting an ability to manage these fiscal challenges, the market has begun to differentiate among securities issued by those states and cities with underfunded pension liabilities by charging higher risk premiums.
Further, in the rare but increasing case of municipal insolvency, bondholders have found that in some cases pension beneficiaries may be given preferential treatment over bondholders. For example, when the City of Detroit emerged from bankruptcy in 2013, the city's pension beneficiaries received a higher recovery than the holders of Detroit's unlimited tax GO bonds.3 As a result, the relative security of GO pledges must be examined closely, and can vary widely among jurisdictions. Deep legal expertise is required to understand and manage the risks involved.
Impact of tax reform — The recent tax reform will impact the municipal bond market primarily in three ways. First, it ended the tax-exemption for new "advance refunding" bonds, which allowed issuers to refinance outstanding debt with tax-exempt debt to take advantage of lower rates in the municipal market. This issuance represented on average 16% (or US$53 billion) of annual tax-exempt municipal bond supply over the past ten years.4 All else being equal, this implies lower levels of annual tax-exempt bond issuance going forward.
Second, the tax reform reduced income tax rates for individuals, potentially reducing the benefit to them of investing in tax-exempt municipal bonds, thereby reducing market demand. On the other hand, the loss of certain state and local tax deductions could stimulate demand among investors in those states.
Third, the tax reform dramatically reduced the corporate income tax rate, the first such change in over 30 years. Since commercial banks and insurance companies own a meaningful portion of outstanding municipal bonds due to the tax benefits, the lower rate could potentially lead to reduced demand or even outright selling, creating potential disruptions in the market.
Index inefficiencies
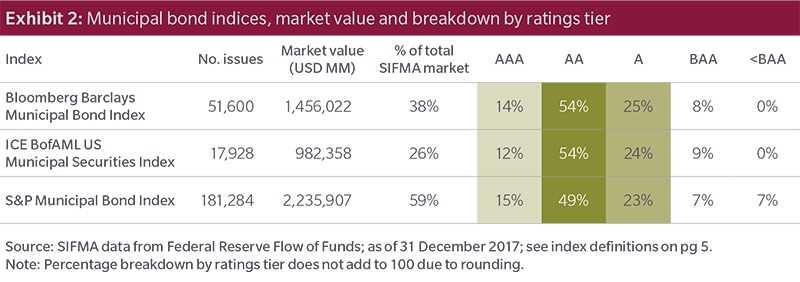
Fixed income benchmark indices are often complex and inefficient. This is also the case for municipal bond indices, which do not adequately capture the investable universe. Exhibit 2 illustrates how the three major municipal bond indices cover only 26% to 59% of the total market and are heavily weighted towards AA- and A-rated bonds. We believe limiting the universe to such high-quality bonds risks missing opportunities for attractive risk-adjusted returns, i.e., returns for each unit of risk taken, that may be available outside the highest-rated bonds.
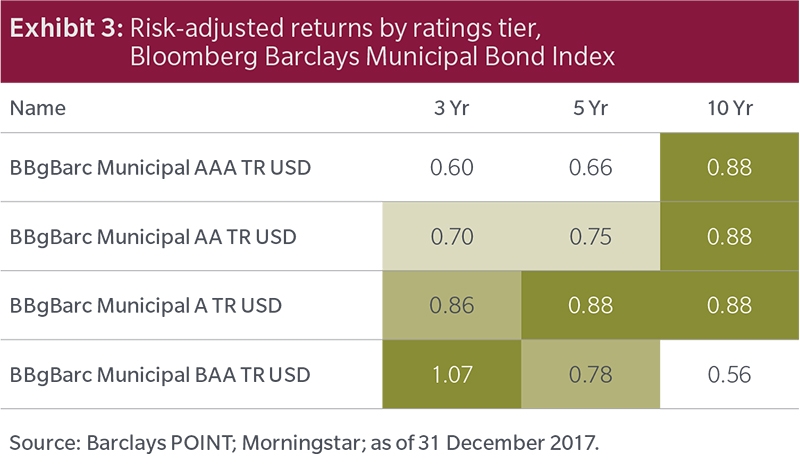
Exhibit 3 shows risk-adjusted returns for different rating tiers of the Bloomberg Barclays Municipal Bond Index. These are Sharpe ratios calculated over a 3-, 5-, and 10-year horizon as of the end of 2017.5 It is worth noting that over the 3- and 5-year horizons, A-rated and BAA-rated bonds offered better risk-adjusted returns when compared to AA-rated and AAA-rated bonds, which account for the bulk of index constituents. Over the 10-year time frame, Sharpe ratios were essentially the same for the AAA to A rating tiers. An active manager with sufficient research resources can identify opportunities such as these and increase portfolio exposure to those bonds potentially offering better risk-adjusted returns.
What we have seen over the last several cycles is a sustained pattern of weaker economic growth (see Exhibit 2) and a strong tendency toward disinflation — meaning inflation that is persistently low or trending lower.
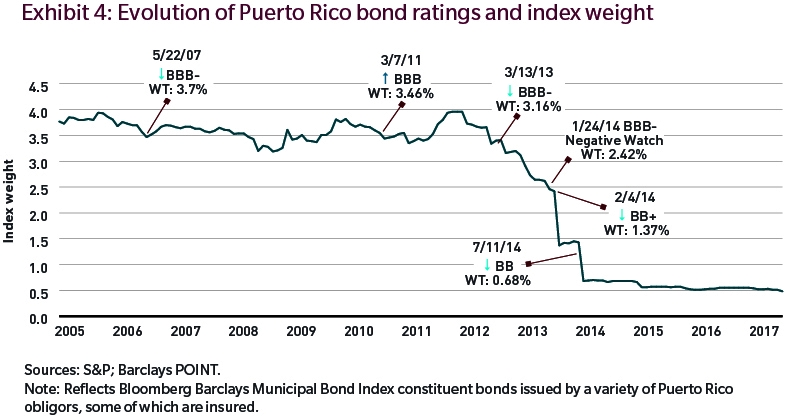
Further, indices are generally slow to adjust constituent bonds and their weighting in response to material changes in quality. For example, from 2010 until it was downgraded to below investment grade in 2014, Puerto Rico continued to be one of the largest (top-10 or 11) issuers represented in the Bloomberg Barclays Municipal Bond Index, despite already apparent weak fundamentals and a poor economic outlook. It is a feature of issuer-weighted indices that the most indebted issuers are often heavily represented. Exhibit 4 shows the evolution of Puerto Rico's weight in the Bloomberg Barclays Municipal Bond Index as it experienced successive rating downgrades. As such, passive investors (who strive to match the returns of the benchmark index) would have held Puerto Rico bonds until they fell out of the index at distressed prices. Active managers with deep legal and credit expertise can navigate these risks.
Conclusion
A number of structural changes have taken place in the municipal bond market since the GFC. There has been a significant decline in the proportion of insured bonds as well as increased fiscal pressures on general obligation issuers, whose bonds are generally perceived to be the safest. These changes haves resulted in a downward migration of ratings and an increased number of defaults since 2007. More recently, US tax reform introduced uncertainty into the supply-demand dynamics of tax-exempt municipal bonds. Further, municipal bond indices do not adequately cover the investable universe, potentially missing attractive risk- adjusted return opportunities and leaving passive investors exposed to declining credits for too long. While active management is not devoid of risk and may attract higher fees, we believe these factors underscore the importance of active manager research expertise and risk management.
More fixed income insights from MFS experts at MFS.com/FixedIncome
40284.1
Definitions
The Bloomberg Barclays Municipal Bond Index measures the municipal bond market.
The S&P Municipal Bond Index is a broad, market value-weighted index that seeks to measure the performance of the US municipal bond market.
The ICE BofAML US Municipal Securities Index tracks the performance of US dollar–denominated investment grade tax-exempt debt publicly issued by US states and territories, and their political subdivisions, in the US domestic market.
Endnotes
1 Source: "Assured, Orrick have momentum entering a challenging 2018," Bondbuyer.com, Jan 17, 2018.
2 Moody's Investor Service, "Default Research: US Municipal Bond Defaults and Recoveries," June 2017.
3 As of 30 November 2014. Source: Municipal Fixed Income, "Lessons from the Detroit Bankruptcy," PNC Capital Advisors, November 2014.
4 J.P. Morgan, "2018 US Fixed Income Municipal Market Outlook."
5 The Sharpe ratio is the average return earned in excess of the risk-free rate per unit of volatility or total risk.
Bloomberg Barclays Indices, POINT ©2018 Barclays Capital Inc. Used with permission. Barclays and POINT are registered trademarks of Barclays Capital Inc. or its affiliates.
"Standard & Poor's®" and "S&P®" are registered trademarks of Standard & Poor's Financial Services LLC ("S&P") and Dow Jones is a registered trademark of Dow Jones Trademark Holdings LLC ("Dow Jones") and have been licensed for use by S&P Dow Jones Indices LLC and sublicensed for certain purposes by Massachusetts Financial Services Company ("MFS"). The S&P 500® is a product of S&P Dow Jones Indices LLC, and has been licensed for use by MFS. MFS's product(s) is not sponsored, endorsed, sold or promoted by S&P Dow Jones Indices LLC, Dow Jones, S&P, or their respective affiliates and neither S&P Dow Jones Indices LLC, Dow Jones, S&P, their respective affiliates make any representation regarding the advisability of investing in such product(s).
BofA Merrill Lynch. BofA Merrill Lynch makes no express or implied warranties or representations and shall have no liability whatsoever with respect to any BofA Merrill Lynch data contained herein. The BofA Merrill Lynch data may not be further redistributed or used as a basis for other indices or any securities or financial products. This report is not sponsored, endorsed, approved, reviewed or produced by BofA Merrill Lynch.
The views expressed are those of the author(s) and are subject to change at any time. These views are for informational purposes only and should not be relied upon as a recommendation to purchase any security or as a solicitation or investment advice from the Advisor.
Unless otherwise indicated, logos and product and service names are trademarks of MFS® and its affiliates and may be registered in certain countries.
Issued in the United States by MFS Institutional Advisors, Inc. (“MFSI”) and MFS Investment Management. Issued in Canada by MFS Investment Management Canada Limited. No securities commission or similar regulatory authority in Canada has reviewed this communication. Issued in the United Kingdom by MFS International (U.K.) Limited (“MIL UK”), a private limited company registered in England and Wales with the company number 03062718, and authorized and regulated in the conduct of investment business by the U.K. Financial Conduct Authority. MIL UK, an indirect subsidiary of MFS, has its registered office at One Carter Lane, London, EC4V 5ER UK and provides products and investment services to institutional investors globally. This material shall not be circulated or distributed to any person other than to professional investors (as permitted by local regulations) and should not be relied upon or distributed to persons where such reliance or distribution would be contrary to local regulation. Issued in Hong Kong by MFS International (Hong Kong) Limited (“MIL HK”), a private limited company licensed and regulated by the Hong Kong Securities and Futures Commission (the “SFC”). MIL HK is a wholly-owned, indirect subsidiary of Massachusetts Financial Services Company, a U.S.-based investment advisor and fund sponsor registered with the U.S. Securities and Exchange Commission. MIL HK is approved to engage in dealing in securities and asset management-regulated activities and may provide certain investment services to “professional investors” as defined in the Securities and Futures Ordinance (“SFO”). Issued in Singapore by MFS International Singapore Pte. Ltd., a private limited company registered in Singapore with the company number 201228809M, and further licensed and regulated by the Monetary Authority of Singapore. Issued in Latin America by MFS International Ltd. For investors in Australia: MFSI and MIL UK are exempt from the requirement to hold an Australian financial services license under the Corporations Act 2001 in respect of the financial services they provide to Australian wholesale investors. MFS International Australia Pty Ltd (“MFS Australia”) holds an Australian financial services license number 485343. In Australia and New Zealand: MFSI is regulated by the SEC under U.S. laws and MIL UK is regulated by the U.K. Financial Conduct Authority under U.K. laws, which differ from Australian and New Zealand laws. MFS Australia is regulated by the Australian Securities and Investments Commission.