


KEY TAKEAWAYS
• While we do not believe the bull market is over, we do believe investors should consider taking some equity risk off the table.
• Risks have begun to stack up and the risk-reward trade-off has become a bit less favorable.
• The longer-term outlook still looks good—we see no recession on the horizon and corporate America is in excellent shape.
We think it is a good time to consider taking a little risk off the table. Two weeks ago we wrote about how stocks are probably due for a pullback given their steady advance and some of the risks facing markets. This past week (August 16), we slightly reduced equity exposure in some of our model portfolios. By doing so, we acknowledged that those risks had begun to stack up during a seasonally weak period and that the trade-off between upside potential and downside risk, at least in the near term, had become a bit less favorable. This week we discuss some of the details behind that tactical decision and reiterate our positive longer-term view.
Disclaimer: Today’s eclipse did not play a role in the tactical asset allocation decision discussed in this report.
What We Did And Why
As always, investors should consider their own individual risk tolerances and portfolio positioning. Here are some of the reasons we chose to slightly scale back our equity exposure and reduce risk in certain portfolios:
• Stocks have had a strong run. The S&P 500 Index’s 10% return year to date is ahead of our 2017 forecast (6–9%). Furthermore, despite Thursday’s declines, the S&P 500 and Dow Jones Industrials Average are both about 2% from their all-time closing highs (the Nasdaq is about 3% away from its all-time high). Although we continue to believe that valuations are supported by earnings growth, low interest rates, and low inflation, it is logical to expect pullbacks to be bigger when they start at higher valuations. The price-to-earnings ratio for the S&P 500, at just over 19 times consensus forward estimates (next 12 months, Thomson Reuters data), is at its highest level since the peak of the dotcom bubble in 1999.
• Volatility drought. Stocks are in one of their longest streaks ever without a pullback. The last 5% pullback in the S&P 500 was in June 2016 (Brexit vote), the longest such streak since 1994–96 and the fourth longest since 1958. Perhaps more unusual is that we haven’t had a 3% pullback since the November 2016 election, a streak only matched once since 1950 (again, in the mid-1990s). Since 1950, the S&P 500 over a one-year period has pulled back 3% or more an average of 4.3 times and 5% or more an average of 2.5 times, so the current environment is unusually calm. We have also seen record low levels of the Chicago Board Options Exchange Volatility Index (VIX), which measures implied stock market volatility based on options prices. Although the VIX rose sharply late last week, at 14, it remains well below its long-term (post-1990) average of 19.
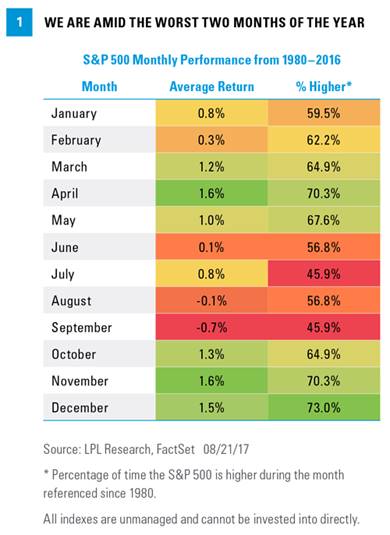
• Weak seasonal period. August and September are the only calendar months that have averaged losses for the S&P since 1980 [Figure 1]. Some of the biggest drawdowns in recent decades have occurred during August and September, including Iraq invading Kuwait (1990), “Asian contagion” (1997), the collapse of Long-Term Capital Management (1998), Lehman’s collapse (2008), the U.S. debt downgrade (2011), and China’s currency crisis (2015). Plus, the calendar is lacking any obvious, potential near-term positive catalysts. The estimated deadline to raise the debt limit is only about a month away and perhaps carries the most potential to be a positive catalyst should it be resolved; our best guess is that it will be without any major market disruption. However, raising the debt limit is not always straightforward, which we learned from the 2011 debt limit debacle that led to the U.S. credit rating downgrade by Standard & Poor’s.
• Earnings season is behind us. Although results were good in terms of upside to forecasts, growth rates, and guidance from management teams, earnings have not been a positive catalyst for the stock market during the just completed second quarter earnings season. In fact, according to FactSet data, shares of companies that have beaten estimates this earnings season have seen an average decline of 0.3% around their reporting date, compared to the five-year average of +1.4% (performance includes two days before and two days after the reporting date). Looking ahead, earnings may not be a positive catalyst for stocks for the next two to three months.
• Central bank transitions. As discussed in our Midyear Outlook 2017 publication, the stock market faces a challenging transition away from central bank support. The Federal Reserve is likely to begin shrinking its $4.5 trillion balance sheet “relatively soon,” per its latest statement, while the market’s expectations for rate hikes are very low, both bringing the potential for a negative surprise.