


With technology stocks resurgent this year, some investors fear a replay of the tech-led rally that pushed stocks to extreme valuations during the 2010s, setting them up for a sharp correction last year. One way to assess if this year’s rally is overdone is to look at how much investors are paying for shares of unprofitable companies, and by that measure, the market is far from its former exuberance.
Investors love to bet on new companies with a lot of hype but no profits. Many of the biggest companies, including Amazon.com Inc. and Tesla Inc., were money pits before they became successful, and the prospect of discovering the next great business can be irresistible.
It’s a game as old as investing itself, but it reached a fever pitch in 2020. The Goldman Sachs Non-Profitable Tech Basket, a collection of not yet bankable companies that included tech darlings Roku Inc., Peloton Interactive Inc. and Lyft Inc., surged 285% in 10 months from April 2020 to January 2021, more than four times the gain of the tech-heavy Nasdaq Composite Index over the same period.
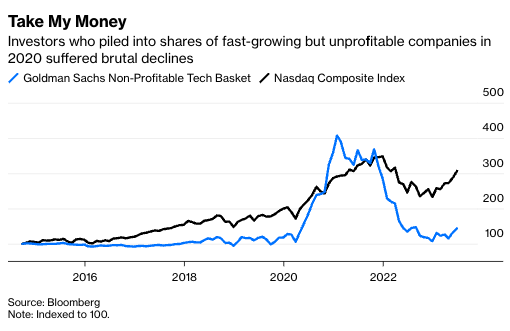
Predictably, the craze ended during the bear market that followed. The non-profitable index tumbled 74% from its peak in January 2021 through the end of last year, nearly four times the Nasdaq’s decline during the same period. But the index has bounced back this year, up 34% through the end of June and 2 percentage points better than the Nasdaq.
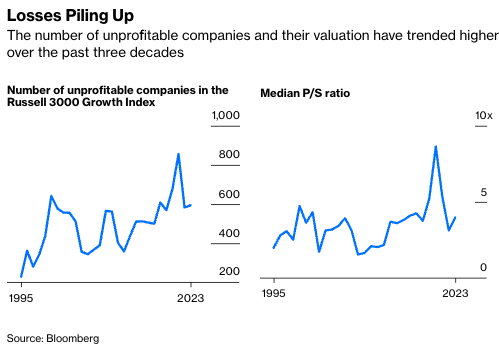
It’s not the first time that investors made big bets on unprofitable companies and suffered an inevitable correction, and they’re not betting only on tech stocks. Goldman’s index has a decade of history, but numbers for the Russell 3000 Growth Index stretch back to the mid-1990s, and it’s packed with fast-growing companies that have yet to turn a profit.
In fact, more than a third of the roughly 1,500 companies in the growth index reported a net loss for their most recent fiscal year, and only about 20% of them are technology companies. The number of unprofitable companies tends to rise and fall with the business cycle, but it has trended higher over time. Roughly 1 in 10 companies in the growth index were unprofitable in 1995; now that number is closer to 40%.
Still, just because there are more unprofitable companies doesn’t mean investors are chasing them. A good way to gauge investors’ interest over time is to track how much they’re paying for these companies relative to some measure of fundamentals, a higher valuation indicating more enthusiasm, and vice versa. The most cited valuation measure, the price-earnings ratio, is no help here because unprofitable companies have no earnings. But they do generate revenue, so I looked at price-sales ratios instead.
These P/S ratios, like the number of unprofitable companies, tend to rise and fall with the business cycle, and they, too, have trended higher over time. The median ratio for unprofitable companies in the growth index is 4 times sales, up from 2 times in 1995. Part of that valuation expansion is driven by investors’ willingness to pay more for stocks generally, as evidenced by the fact that the growth index’s P/S ratio of 3.6 is more than double what it was in 1995.
A way to account for the broader valuation environment is to compare the median P/S ratio for unprofitable companies with the P/S ratio for the broader growth index. That ratio of P/S ratios hasn’t moved much over the past three decades, although it has experienced some gyrations. Tellingly, its peaks aligned closely with market tops during the dot-com era in the late 1990s, the 2008 financial crisis and most recent market top in 2021. It tumbled near its historical low last year and remains near there even after the rally this year. So investors’ fondness for unprofitable companies is much more muted than it was.
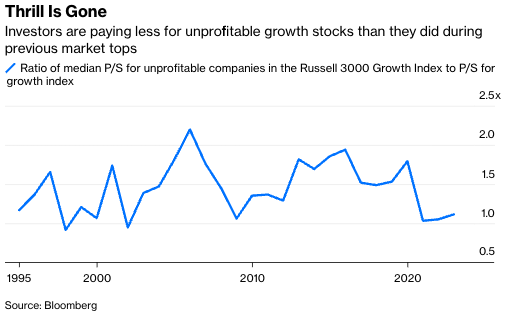
That doesn’t mean investors can’t get hurt. Amazingly, the median P/S ratio of unprofitable companies has almost always been higher than that of the broader growth index and remains so today. That means investors are probably still paying more for unprofitable companies than other fast-growing businesses that already make money.
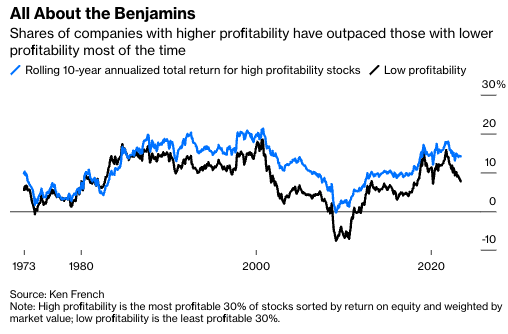
If history is any guide, that’s a bad trade. Valuation aside, shares of the most profitable 30% of U.S. stocks have outpaced the least profitable 30% by 3.9 percentage points a year since 1963, including dividends, and 92% of the time over rolling 10-year periods, according to numbers compiled by Dartmouth professor Ken French. Throw in valuation, and the results are even starker. Shares of the cheapest and most profitable companies have outpaced the most expensive and least profitable ones by an astonishing 8.9 percentage points a year and 78% of the time over rolling 10-year periods.
The problem with fast-growing but unprofitable companies is that most of them never become profitable or fail to live up to lofty expectations, requiring their stock prices to correct. Unless investors can reliably pick the winners in advance, betting on unprofitable companies is likely to be an expensive hobby.
For now, the good news is that bets on unprofitable companies are tamer than usual. If the fear is that this year’s rally is a return to the frothy market that preceded last year’s downturn, by at least one measure it’s not even close.
Nir Kaissar is a Bloomberg Opinion columnist covering markets. He is the founder of Unison Advisors, an asset management firm.
This article was provided by Bloomberg News.