


Dividend-Focused Strategy
Investors focus on total return when investing, not just capital appreciation or income. Although capital appreciation may at times provide the bulk of total returns, income has contributed its fair share as well. A broad equity index for all decades from 1871 to 2010 had an annualized total return of 8.8 percent over the entire period; the income component was 4.6 percent (52.3 percent of the total). The income component of total return was not only greater than the capital appreciation, but also significantly less volatile. The income component ranged from 6.4 percent to 1.9 percent, annualized over the 10-year periods. However, price appreciation was as high as 14.9 percent and as low as -2.8 percent. This wide range is unfavorable for investors when compared to the income component, which can never be negative.
Figure 1 assumes if you bought one share of the S&P 500 Index on December 31, 1969, it would have cost you $92.06. In each subsequent year you chose to spend the dividends rather than reinvest them. In 1970, you would have received dividends totaling $3.14, for a 3.41 percent yield on cost; by 1980, your annual dividend would have increased to $6.16, for a 6.69 percent yield on cost; in 1990 you would have received $12.09, for a 13.13 percent yield on cost; and in 2011 you would have received $26.43, for an attractive 28.71 percent yield on cost. In fact, the average annual increase of the dividends over the entire 44-year period was 6.06 percent. This growth in dividend cash flow that occurred in the broad S&P 500 Index, with no dividend reinvestment, piqued our interest relative to its potential impact on a retirement portfolio in distribution.
We purchased a Standard and Poor’s database of monthly returns for the top 20 percent of dividend-paying companies in the S&P 500 Index (hereafter, the S&P Top 100 Dividend Payers). This database begins in 1968, is equally weighted, and provides returns through the present. Performing an initial comparison of the S&P Top 100 Dividend Payers to the S&P 500 Index reveals the characteristics shown in Table 1.
The S&P Top 100 Dividend Payers had a compounded annual return of 12.71 percent, 259 basis points higher than the S&P 500 Index. This increase, together with a small increase in the standard deviation, results in the Sharpe ratio — which measures the ratio of reward to risk for an investment — improving by 28 percent. Upon seeing these results, we reflected on Bengen’s book, in which he determined that applying an investment strategy with the ability to consistently provide superior risk-adjusted returns in excess of the index had a positive effect on the maximum withdrawal rate that could be used.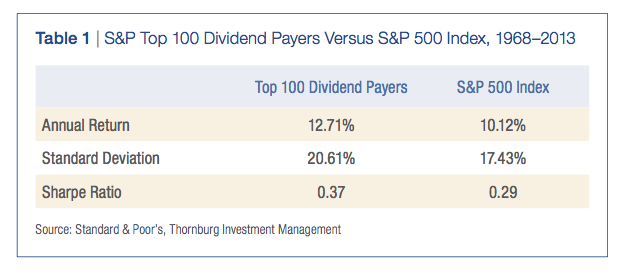
Effect Of Performance On Sustainability
Before we studied the impact that a high and growing dividend strategy would have on the withdrawal rate, we wanted to understand how the performance of the S&P Top 100 Dividend Payers would affect the sustainability of a retirement portfolio in distribution. Bengen graciously provided information that allowed us to replicate the work he had done, albeit much more simplistically, since we were trying to solve for only one factor to compare performance of the Top 100 Dividend Payers with performance of the entire S&P 500 Index. We constructed a model and assumed a $1 million investment in a portfolio allocated to 60 percent equities and 40 percent bonds, using the Barclays Intermediate Government Bond Index for the bond portion. For the equity portion, we used either the S&P 500 Index or the S&P Top 100 Dividend Payers. Monthly return data were used and both portfolios were rebalanced at the end of each year. In addition, we assumed a 5 percent spending rate: $50,000 was withdrawn at the beginning of year one of the retirement, then increased by a cost-of-living adjustment each year thereafter. These annual spending amounts were removed from the investment account at the start of each year and assumed to be placed in a checking account for spending purposes.