


Now comes the hard part. The post-Covid wave of inflation broke almost uniformly across the world, much like the pandemic that caused it. After unleashing a flood of cheap money to tide the world through 2020, central banks had to raise rates to combat inflation. Some took much longer than others.
With peak inflation behind us in most countries, they face the challenge of retreating without tipping into a recession, or allowing price rises to return. Despite understandable impatience, they need to proceed with extreme caution; this is the most hazardous stage in their journey, and the way the monetary response has splintered adds to the risks. Last week alone:
- The Swiss National Bank became the first developed market central bank to cut rates since the crisis.
- Taiwan sprung just as big a surprise by raising them.
- The Bank of Japan hiked for the first time in 17 years.
- Turkey raised by 5 percentage points while Brazil cut by 0.5 percentage points.
- Most of the world’s biggest central banks, led by the Federal Reserve, are uncomfortably on hold.
No wonder it’s become popular to compare monetary policy with scaling mountains. How to get down? Instead of a Matterhorn, in which rates form a perfect triangle by rising and then fall in diagonal lines, the situation could prove more like South Africa’s Table Mountain, with a long plateau before the climbdown can start. For central bankers—stranded with policy rates far too high for their comfort but reluctant to take the risk of cutting them—the analogy is doubly uncomfortable. Descending a mountain is more hazardous than the ascent. That’s when accidents happen.
For mountaineers, there’s safety in coordination, and they rope themselves together. It’s the same for central bankers facing their own descent; they are tied to each other, they are safer if they all move as one, and there are dangers if they cannot move together.
To track the climbdown, Points of Return is launching The Year of Descending Dangerously, a suite of indicators that we will update monthly. The chances are that it will take longer and move more slowly than many now seem to anticipate, and that central bankers will need to keep treading cautiously. We hope that these indicators will help everyone find the right path.
The Pandemic Inflation Shock
Initially, Covid’s global impact on prices was strikingly uniform. Inflation tends to be lowest in the developed world and highest in frontier markets (developing economies that have not yet come far enough to be labeled emerging). In 2020, consumers suddenly stopped spending, inflation fell everywhere and central banks desperately flooded the market with cheap money. As the world reopened in the face of supply bottlenecks in 2021 and 2022, prices rose more or less universally. Since then, the divide has opened. That shows up clearly when we look at the average rates of inflation for the developed, emerging and frontier worlds, going back to 2014:
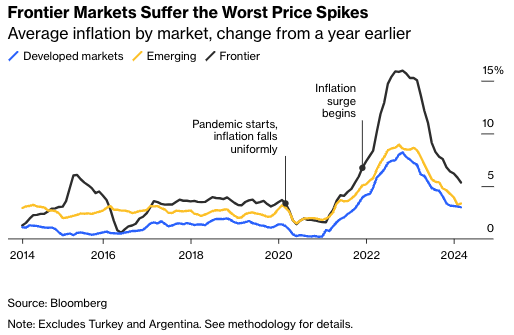
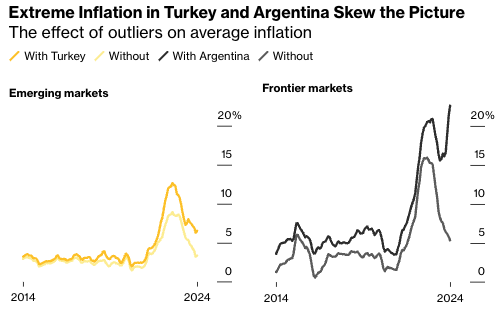
That chart is our best attempt to simplify and show the global trends in inflation. The numbers are calculated as an average and exclude Turkey and Argentina, which are both such special cases that it’s best to omit them. Turkey has been saddled with inflation that’s now close to 70% after crazy interest rate cuts from 2021 to 2023. And in Argentina, where inflation is now 276%, the reasons date back long before the pandemic. Including the South American country in calculations would bring the mean for frontier markets to almost 25%.

How The World Responded
Now, coordination has fallen apart. Some emerging-market central banks, such as Brazil’s, are well advanced in their campaigns of interest-rate cuts, with inflation down to levels their people can accept. Their real rates—or the amount by which official rates exceed inflation—remain high, creating confidence that there is further easing in the pipeline. In the developed world, only Switzerland, where inflation was never that high, has started the descent, and central bankers have a collective action problem. High rates in the U.S. make it harder for others to cut, even though their slowing economies need some relief.
In this chart, we compare interest rates since the pandemic started in 56 individual markets and the eurozone using z-scores, a measure of standard deviation. That shows how far away a number strays from the mean or average and demonstrates how each market compares to the previous 10 years. These numbers help account for the fact that developed markets tend to have lower rates. For example, a 5% interest rate is far more shocking in the U.S., which had never reached such a level since 2007, than it would be in Mexico, where rates have averaged 6% since then.
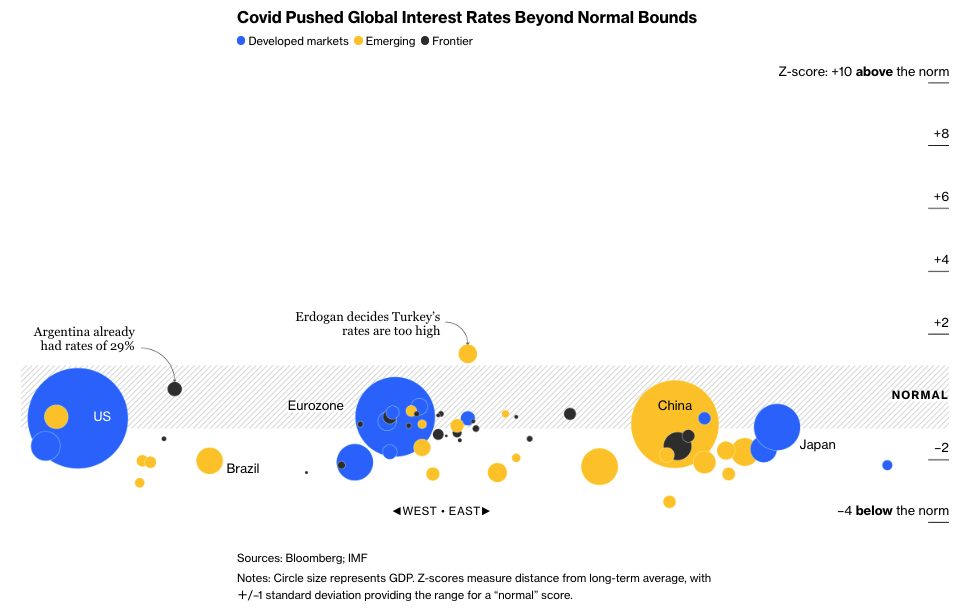
Initially, there was near-total unity; in 2021, with vaccines only just starting to roll out, almost everyone kept interest rates at rock bottom, even as post-pandemic supply bottlenecks forced up prices. By 2022, emerging markets were tightening swiftly, but developed markets were slower on the uptake. Now, central banks are in wildly different parts of the cycle—even if most still have historically high rates.
(Note that the cutoff for this chart was March 1, so it doesn’t include the latest flurry of decisions, including the Bank of Japan’s epochal decision to raise rates above zero, after they had been parked at –0.1% for eight years. In absolute terms, their rates remain near rock bottom; in relative terms, this was a huge shift. We will update next month.)
As you can see, developed markets have rates more than five standard deviations above the norm—levels that people had confidently assumed during the disinflationary decade they would never see again. Many financial structures now in place in the U.S. or western Europe were built—consciously or otherwise—on that assumption; that explains the fears that higher-for-longer rates could spark financial crises in the developed world, as already happened with the meltdown in the U.K. government securities, or gilts, market in September 2022 and the U.S. regional bank collapses in March 2023. There’s a reason why the European Central Bank (ECB) or the Federal Reserve want to cut. But they can’t do so yet, in large part because they waited too long to start the ascent.
How Emerging Markets Got It Right
Markets regarded as “emerging” look to have emerged. Indeed, they’ve shown better economic management than their peers in the developed world. Disinflation is well underway (with the major exception of Turkey). That’s why Brazil and Mexico made cuts in March while the ECB and the Fed had to hold. They also showed that they deserved emerging status by controlling price rises far better than the nations of the so-called “frontier”—still too poor or with insufficiently liquid and accessible markets to be called emerging.
Looking at the raw numbers, it’s obvious the descent has a long way to go—across the world, rates are above inflation, meaning that policy is tight and restricting economic activity.
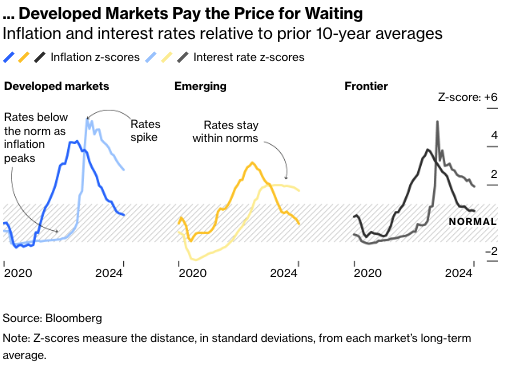
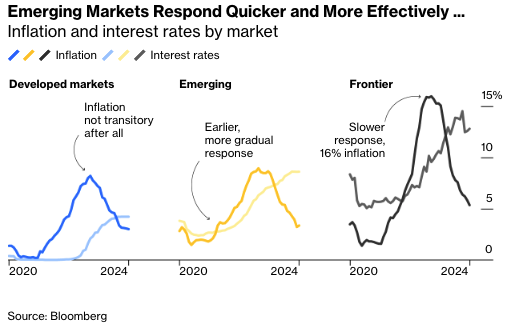
The z-score scale shows how developed markets waited too long and then inflicted an appalling shock on themselves, in a pattern echoed on the frontier. In the emerging world, the ascent started earlier and was far more gradual, resulting in far lower peak inflation than was suffered in the frontier. There, rates stayed just within two standard deviations of their norm for the decade. The financial crises of the last two years have hit the U.K., the U.S. and Europe, but not the emerging world; these charts largely explain why.
The Treacherous Descent Ahead
Around the world, coordination grows ever harder. U.S. inflation is annoyingly sticky, which makes interest rates sticky as well. The Fed wants to cut rates as soon as June, but can make no promises. And as the American economy remains in good shape, there is little urgency. That creates a problem for everyone else; the economies of western Europe are currently much weaker, and so cuts there do matter.
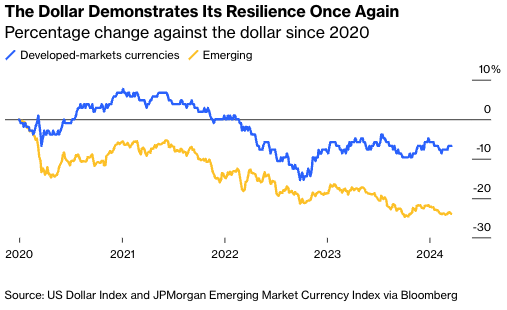
The high U.S. rates also attract funds from other markets into its cash and bonds. That weakens other currencies—making their exports more competitive while pressuring inflation by pushing up the price of imports. It also makes dollar-denominated debt more expensive to service, although thankfully this is another area where emerging markets have largely emerged; they’ve now developed local bond markets and borrow much less in dollars. Their currencies are under unrelenting pressure, but the stakes aren’t as high as they once were:
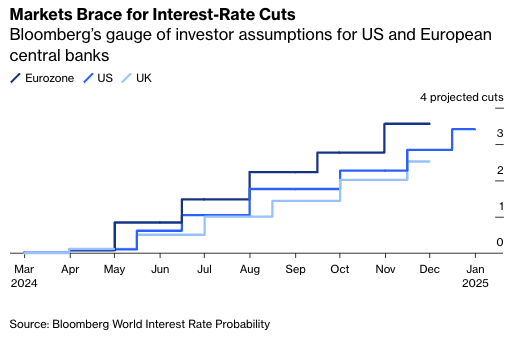
The crucial question is how quickly central banks can move. Bloomberg’s handy World Interest Rate Probability (WIRP) function calculates the implicit forecast for rates after each meeting over the next year for the biggest developed world central banks, based on pricing in futures and overnight index swaps markets. This is the purest gauge of investors’ assumptions, which often have real world impacts. If overnight rates, the shortest-term rate controlled by central banks, are expected to fall soon, that will reduce bond yields or mortgage rates without central bankers needing to do anything.
At the end of 2023, WIRP showed that investors were ready for steep cuts this year, with seven cuts of 0.25 percentage points expected from the Fed. That has been scaled back, with three cuts now thought to be as far as the Fed can go. In the following chart, we show the current predictions for the “landing path” for the Fed, the European Central Bank, the Bank of Canada and the Bank of England. All would prefer to wait until the Fed has started to ease rates, but the market now believes they will have no choice but to cut first.
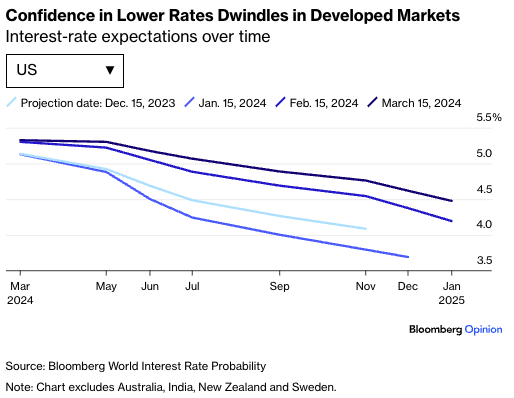
The implicit landing paths for 10 markets covered by WIRP have shifted significantly so far this year, with investors now resigned to far fewer early cuts than they once expected. Not only is the descent hazardous, but there’s gloomy acceptance that it’s going to take longer than once hoped; in this chart you can see how the projected move in rates has moved over time for each of the major central banks.
This article was provided by Bloomberg News.