


One of the most reliable signals of a pending recession is when, in the jargon, the yield curve inverts. This sounds like a fancy phrase, but it simply means that investors demand to be paid more for a short-term loan than for a long-term one.
Normally, this demand makes no sense. Longer-term loans are riskier than short-term ones, as more can go wrong. So, you would expect them to cost more and to have a higher interest rate than short-term loans. The only reason that dynamic would reverse, that the yield curve would invert, is if investors expect risks to increase substantially very soon—like if they expect a recession. A yield curve inversion works both theoretically and empirically as a recession indicator. In fact, an inversion really is the best indicator of a pending recession, which is why we use it in the monthly Economic Risk Factor Update.
When you look at how a yield curve inversion plays out with Fed policy, though, you can take the analysis to the next level.
Why Does The Yield Curve Invert?
The light blue line in the chart below illustrates the yield curve spread: the difference between the interest rates on the 10-year and 3-month U.S. Treasury debt. As you can see, when it drops below zero (i.e., when the yield curve inverts), we have a recession within the next couple of years. So far, so good.
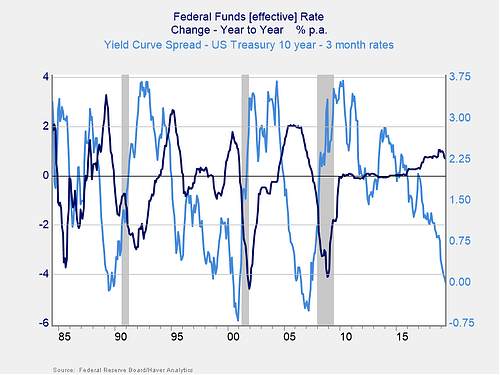
But the interesting follow-up question here is, Why does the yield curve invert? There are two possibilities. First, longer-term rates could drop, while shorter-term rates remain constant. Second, shorter-term rates could increase, while longer-term rates remain steady. The second possibility would mean that the Fed is a principal driver of the inversion. Therefore, it ties directly to the current discussion around the Fed’s interest rate policy and whether it should and will cut rates.
What Will The Fed Do?
We have seen both of these possibilities play out. But look at the dark blue line in the chart, which is the change over the prior year in the Fed funds rate. Here, we can see that the more common case is that when the Fed hikes rates—when the dark blue line rises—we see the spread declining. Fed policy is clearly the more important factor, over time. It can, as we saw in 1989, 1999, and 2006–2007, push the curve into inversion and the economy into recession. Which brings us to today.
The Fed has been hiking, slowly but steadily, for a while. Although the year-on-year hikes have peaked at around 1 percent, rather than the previous 2 percent, we can see the same effect underway. Clearly, despite the low level of rates and the fact that the hiking path has been slower and smaller, the Fed has once again pushed the curve down into inversion by raising short-term rates. Any further hikes would likely push the curve spread even more negative.