


A lot of these are the kinds of places where big corporations locate back-office operations (and, increasingly, not-so-back-office ones) to save on real estate and labor costs, or secondary tech industry hubs where similar considerations are at work. Lots of individuals appear to be making equivalent calculations about cost and quality of life.
But there’s also the San Francisco area, which is awfully expensive and sure seems like a primary tech industry hub, yet had more residents working at home in 2018 than all of the areas in the first chart combined. Then again, metropolitan San Francisco is not quite as expensive and maybe isn’t quite as primary a tech hub as the neighboring San Jose metropolitan area, where the work-at-home percentage is a below-the-national-average 5%. And there’s an interesting story in that.
I discovered it after downloading the Census Bureau’s estimates of 2014-2018 work-at-home percentages for all the country’s cities, towns and census-defined places. After I eliminated the tiniest ones, Fort Leonard Wood, Missouri, another U.S. Army installation, came in first, at 51.6% (give or take an 8.9-percentage-point margin of error) and the aforementioned Northfield was pretty high on the list at 33.7%. As I sorted and re-sorted by various criteria, two things stood out.
One was that some pretty big cities had high work-at-home percentages: Portland (8.2%), Austin (8.1%), Denver (8%), Atlanta (7.8%), Seattle (7.2%), San Diego (7.1%), San Francisco and Oakland (6.6% each). New York City doesn’t (4.2%), but the borough of Manhattan does (6.9%). Working at home isn’t solely a small town or suburban thing.
Work-from-home percentages in the double digits are found almost exclusively in small towns and suburbs, though, and the other thing that stood out to me was how many of the places above that threshold are in California and especially Northern California. By my count about 8% of the U.S. cities, towns and places with more than 1,000 workers and a work-at-home share of 10% or more from 2014 through 2018 are in or right on the edges of the San Jose-San Francisco-Oakland combined statistical area, aka the Bay Area, which is home to 3% of the nation’s population.
These places include a lot of scenic enclaves nestled in the area’s mountains or along the coast — mini versions of the resort towns in the first chart. But there’s also the city of Berkeley (10.1%), plus a lot of affluent suburbs in Marin County and the East Bay, including the one where I grew up, Lafayette (11.5%). These are all an easy enough daily commute to San Francisco but not to the area’s greatest source of wealth and high-end work in recent decades, Silicon Valley. In the meantime, while housing in these places is awfully expensive by national standards, it’s cheaper than in Silicon Valley. And so (I conjecture, with some anecdotal backing) they are inhabited by growing numbers of people with jobs that require some proximity to Cupertino, Mountain View, Sand Hill Road or the like, but can be done most days from home.
Working from home in a Bay Area suburb or mountain enclave may of course lose in attractiveness if the gigantic wildfires of the past few years persist. But I don’t think such arrangements are just a way station on the path to a new normal in which agglomeration effects no longer matter and knowledge industries cease to cluster in specific places because nobody ever goes to the office anyway. The advantages of frequent if not necessarily daily in-person contact with colleagues and peers, of living near multiple employers in your field, with career opportunities for both members of a two-income couple, not to mention all the cultural and other attractions of metropolitan life, will I think continue to weigh heavily in favor of large metropolitan areas. In fact, more people working from home may make such places more livable both for the remote workers who no longer have to commute every day and the commuters who still do.
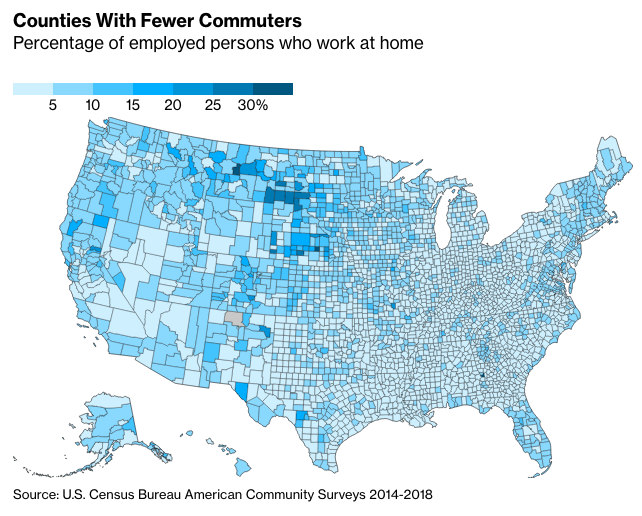
Finally, I also looked up the work-at-home percentages for all the nation’s counties for 2014-2018.
The darkest spots on the map are for the most part rural counties in the Great Plains with very few people, many of them farmers or ranchers. Petroleum County, Montana, population 487, is No. 1 with 36.2% of employed persons working at home, give or take 9.2 percentage points. Beyond that the work-at-home shares do seem to be higher in mountains and along some coasts, and lower in the Rust Belt, the South and a big swath of Arizona, California and Nevada. Maybe there are are important lessons for the future here. Or maybe it’s just a pretty map.
Justin Fox is a Bloomberg Opinion columnist covering business. He was the editorial director of Harvard Business Review and wrote for Time, Fortune and American Banker. He is the author of The Myth of the Rational Market.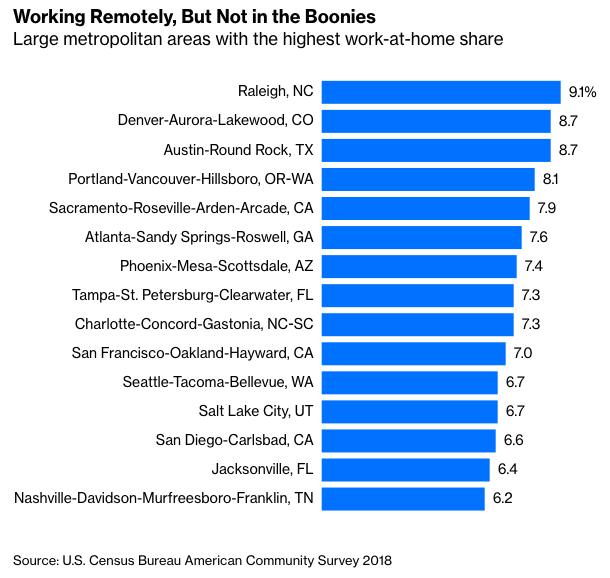
The Rise Of Work-From-Home Towns
August 27, 2020
« Previous Article
| Next Article »
Login in order to post a comment