


Key Points
• It’s been 10 years with no growth in earnings and nine years with no gain in the stock market.
• Fortunately, earnings are unlikely to remain stalled as they have since 2007 since profit margins are in the middle of the 20-year range and not the top, and the sector distribution of profits are much more evenly balanced.
• Stock market valuations appear to us to point to mid-single digit average returns for the next 10 years, not zero.
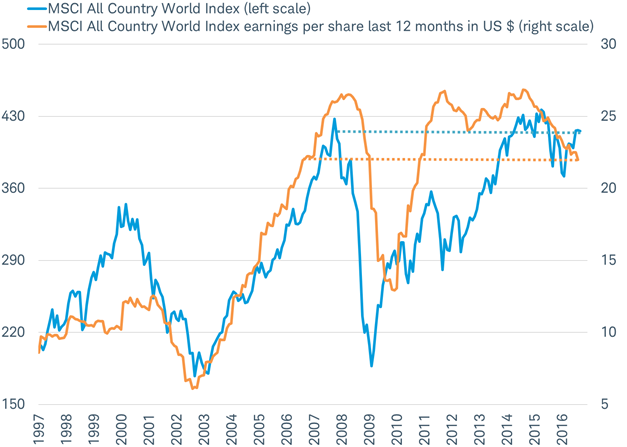
The end of September marked 10 years with no growth in earnings and nine years with no gain in the stock market—the earnings per share for the companies in the MSCI All Country World Index stands where it did in September 2006 (at about $22) and the index itself first reached the current level (about 410) in September 2007, as you can see in the chart below. Since earnings are the lifeblood of the stock market, without any growth in earnings, stocks have made no progress—despite aggressive monetary stimulus from policymakers.
A lost decade of profits and performance
Source: Charles Schwab, Factset data as of 9/30/2016.
Comparing three key drivers of both earnings per share and stock prices today with a decade ago appears to reveal a much more favorable outlook for growth in the decade ahead.
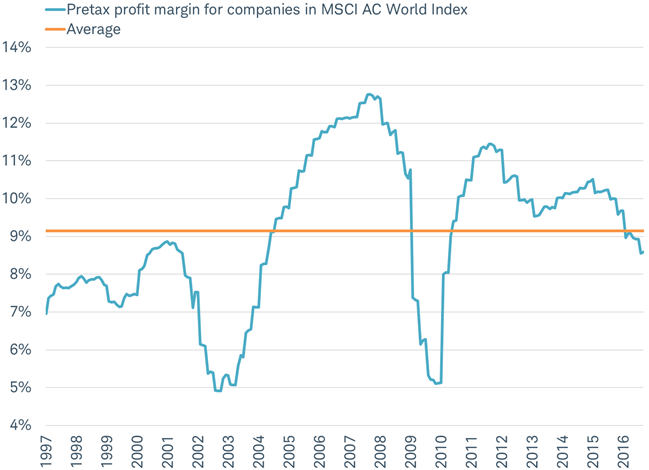
1) Profit margins are in middle, not top, of a 20 year range
In September 2007, pre-tax profit margins for global companies were at all-time highs, but are now just below their 20-year average. Why does this matter? Think of it this way: as the profit margin earned on each sale fell by a third (from almost 13% to 8.5%), sales volume had to grow by 30% just to keep overall earnings flat.
Profit margin now below 20 year average
Source: Charles Schwab, Factset data as of 10/13/2016.
A global recession occurring sometime within the next 10 years may result in a temporary drop in profit margins at that time, but on average, over the next 10 years, profit margins are likely to remain close to where they are today. An end to the drag on earnings due to the long-term decline in profit margin may mean that the next 10 years holds a much brighter outlook for profit growth.
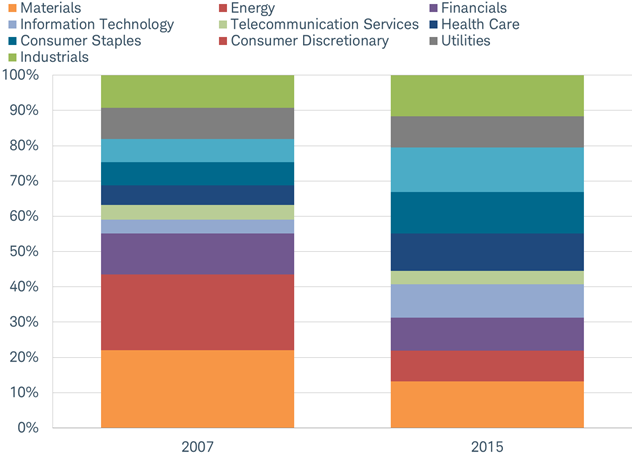
2) Earnings are now much more balanced across sectors
In 2007, nearly 50% of the earnings of global companies came from just two sectors: energy and materials. As of 2015, earnings are much more balanced across all sectors, as you can see in the chart below. The greater diversification across sectors makes overall earnings less vulnerable to a crash in one or two sectors.
Earnings are more diversified and less vulnerable to a crash in a particular sector
Earnings by sector for MSCI AC World Index
Source: Charles Schwab, Factset data as of 10/13/2016.
Currently, the relatively even distribution of earnings across sectors suggests no profit bubble in any sector. This distribution provides a broader and more resilient basis for earnings growth in the coming 10 years compared to 2007.
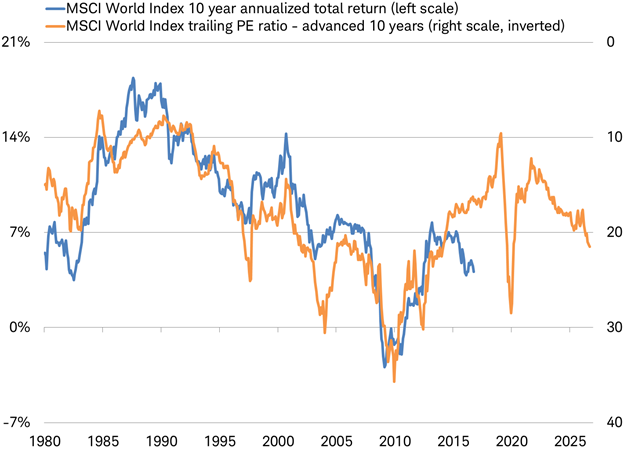
3) Valuation points to mid-single digit total returns
Historically, the trailing 12 month price-to-earnings (PE) ratio has been a good indicator of the total return (index price gain plus dividends) for stocks over the next 10 years, as you can see in the chart below. The more expensive (higher PE) stocks are, the lower their long-term returns.
Stock market performance has followed valuation
Source: Charles Schwab, Factset, Bloomberg. Data as of 10/12/2016.
If stock performance over the next 10 years continues to track valuations, the current PE of just over 20 suggests an average 10 year total return of just under 7%. While this is below the long-term average total return, it is well above zero.
A Found Decade Ahead
A lost decade shouldn’t mean lost hope. Investing is an act of hope and optimism about the future. These three key drivers offer strong reasons for investors to find hope for better returns in the decade to come.
Three Reasons Stocks May Avoid Another Lost Decade
October 18, 2016
Jeffrey Kleintop is senior vice president and chief global investment strategist at Charles Schwab & Co.
« Previous Article
| Next Article »
Login in order to post a comment