Traffic jams cause more than road rage and late arrivals, according to a recent research report. It costs cities significant amounts of money.
INRIX Research studied U.S. traffic hotspots or locations that have reoccurring traffic jams along a long stretch of road between March and April of 2016. The report identified some of the worst traffic hotspots throughout the U.S. and their economical impact to the city and the households within it.
Traffic hotspots impacted drivers, passengers and freight movers through lost time, wasted fuel and carbon emitted. From a ranking of 25 cities, traffic congestions are projected to cost drivers $480 billion within the following nine years. And all U.S. traffic hotspots are expected to cost citizens $2.3 trillion by 2026. Reportedly, New York had more traffic hotspots than other cities listed, but Los Angeles’ traffic jams financially impacted Angelenos more.
Though, the study was created to assist transportation agencies in analyses of roadways, the report also validates commuters’ frustrations and can lead to more sensible financial managing.
Here is a list of the top 10 congested cities throughout the U.S. and the possible economic cost of their congestion. These cities are ranked according to the INRIX Global Scorecard, a methodology to evaluate urban travel, and the top hot spot in each city is included.
No. 1 Los Angeles

Top Hotspot: I-405 N at Exit 43 to Exit 21. L.A. saw a little over 128,000 traffic congestions in March and April of last year, with drivers spending 104 peak hours in traffic jams. INRIX projected the economic cost of traffic hotspots will cost more than $90 billion by 2026. LA’s top hotspot saw 2,032 traffic jams alone, with an average duration of 23 minutes and an expected economic cost of $1.9 billion by 2026.
No. 2 New York City

Top Hotspot: Brooklyn Queens Expy E at Exit 28A to W Shore Expy. The concrete jungle’s 13,608 hotspots had an estimated economic cost of $64 billion in lost time and wasted fuel. But the top hotspot is expected to cost drivers $992 million by 2026. Between March and April of last year, the expressway had 462 traffic jams with and an average duration of 64 minutes.
No. 3 San Francisco
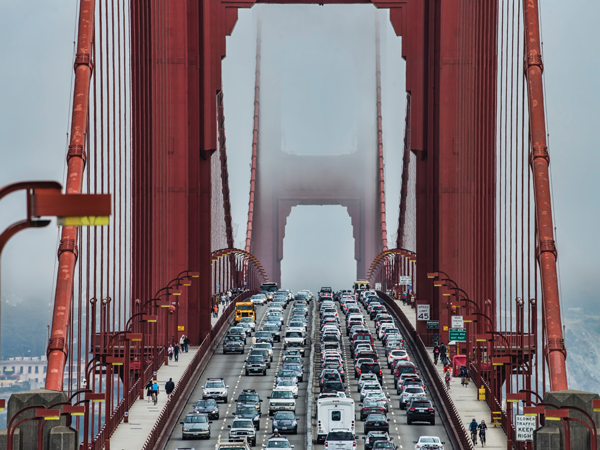
Top Hotspot: I-80 W at Emeryville to CA-4. The Bay Area was one of a few cities found to have the most severe traffic jams, but came in third place. Drivers spent 83 peak hours in congestion. The expected economic cost is $27 billion by 2026. The top hotspot saw 504 traffic jams in the two-month study with an average duration of 53 minutes. It’s expected to cost household’s $854 million.
No. 4 Atlanta

Top Hotspot: I-285 S at I-20 to Route 23. Atlanta ranked fourth on this list. Drivers spent 71 peak hours sitting in congestion. The city saw over 58,000 traffic jams in 8,554 traffic hotspots. INRIX research suggests the economic cost to be $28.9 billion by 2026.
No. 5 Miami

Top Hotspot: I-95 N at Exit 12A to US-1. Miami had over 6,500 traffic hotspots that accumulated about 60,000 congestions during the period covered in this study. Drivers spent 65 peak hours in traffic. At this rate, the economic cost could reach $28.9 billion by 2026. Miami's top hotspot had 229 traffic jams with an average duration of 33 minutes. That spot could have an economic cost of $458 million by 2026.
No. 6 Washington, D.C.

Top Hotspot: I-95 S at Exit 133A to Fairfax County Parkway. The nation’s Capital saw 50,007 traffic congestions in 6,097 traffic hotspots between March and April of last year. Drivers spent 61 peak hours in those traffic jams. If traffic hotspots don’t improve, the economic cost is expected to reach $28.9 billion. As for the top hotspot, it saw a little over 1,300 traffic jams in the two-month time span with an average duration of 33 minutes. The economic cost is projected to reach $2.3 billion by 2026.
No. 7 Dallas

Top Hotspot: I-20 W at Exit 451 to Exit 466. Dallas had 6,720 traffic hotspots. There were 58,536 traffic jams and drivers spent 59 peak hours in congestion. INRIX reported the economic cost to reach $28 billion by 2026. Its top hotspot saw 115 traffic jams with an average duration of 109 minutes. That spot alone is expected to cost $446 million by 2026.
No. 8 Boston

Top Hotspot: Massachusetts Tpke E at Boston U Bridge to Oak St. INRIX reported over 4,000 traffic hotspots and 26,844 traffic jams in the two-month span. Drivers spent 58 peak hours in traffic. The city’s top hotspot saw 401 traffic jams and an average duration of 35 minutes. Its projected economic cost is $672 million by 2026.
No. 9 Chicago

Top Hotspot: I-90 W at 81A to Exit 56B. Chicago’s most congested spot saw 238 traffic jams in the two-month time span with an average duration of 79 minutes. INRIX predicts this hotspot will cost drivers $1.3 billion by 2026.
No 10 Seattle

Top Hotspot: I-5 S at Pike St to 128th St/Exit 186. The Emerald City had 3,675 hotspots and 26,844 traffic jams between March and April of last year. INRIX reported an expected cost of 18.9 billion by 2026. The city’s top hotspot had 406 traffic congestions and an average duration of 39 minutes. The economic cost could reach $756 million by 2026.
To get the full report, click here.


