


October has the reputation as one of the most volatile months. In fact, going back to 1950, no month has a wider average monthly range (from low to high), at 7.3%. Also, 24.6% of all the days in October since 1950 have closed up or down at least 1%, again the highest for any month. The bottom line is the volatility that started late last month will likely stick around in October.
Here’s the good news: October has been very strong lately. In fact, over the past 20 years no month sports a higher average gain, at 2.1%. That is all the more impressive when you factor in the 16.9% drop in 2008. Going back to 1950, October ranks around the middle of the pack month, up 0.9% on average, which ranks seventh out of the 12 months.
As Figure 2 shows, October has been strong recently, but November and December are also historically strong months for stocks.
A Closer Look at Election Years
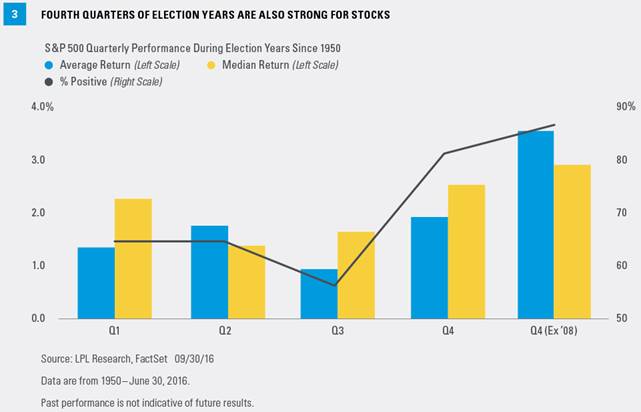
This is a presidential election year, so the question of what impact this might have on the stock market always comes up. Well, the fourth quarter of election years has been lower three of the past four cycles, with a huge drop of 22.6% in 2008 mixed in there. But here’s the catch: during election years from 1952–1996, those 12 fourth quarters were all higher. Taking a closer look at those past four cycles, 2000 and 2008 were in the midst or just ahead of recessions, so that played into the weakness those years. With minimal chance of a recession this year based on leading indicators, that increases the odds of the normal historical bullish backdrop returning.
As Figure 3 shows, in all election years since 1950, the fourth quarter is once again the strongest of the year, with an average gain of 1.9%. This is below the average fourth quarter return of 4.1% shown in Figure 1; but if you remove the outlier drop in 2008, this average jumps to 3.5%—more in-line with past performance.
What About Sectors?
The fourth quarter is usually a strong one for U.S. equities, but what about sectors? Starting in 1997, the top performing sector (based on the S&P 500 GICS sector indexes) is information technology with an average gain of 7.3% [Figure 4]. This is interesting, as tech had lagged much of last year and earlier this year, before its big third quarter rally (+10.6%) on a strong second quarter earnings season. If tech can continue to lead, that could be a very healthy sign for equity markets in general, as this group has the largest weighting in the S&P 500.
What Could Drive the Fourth Quarter?
Of course the biggest event for investors to consider in the fourth quarter is the U.S. presidential election. The next two debates are slated for October 9, 2016 and October 19, 2016, ahead of Election Day on November 8. Markets have expressed some preference for the decreased uncertainty of a Clinton presidency so far, although the race is close enough that markets may be volatile in October and early November.