Stocks made a new all-time high on the first day of trading in 2022, but it was a very rough month from there. In the end, the S&P 500 Index lost 5.3% in January, for the worst first month of the year since 2009. It could have been worse though, as a huge 4.4% rally the last two days of January checked in as the best end of month rally since November 2011.
There’s an old adage on Wall Street that suggests, “As goes January, so goes the year.” This is widely known as the January Barometer and was first discussed in 1972 by Yale Hirsh of the Stock Trader’s Almanac, and it has an impressive track record. Simply put, when the first month of the year was green, it bodes well for the rest of the year (and vice versa). Given stocks closed red in January, how worried should investors be?
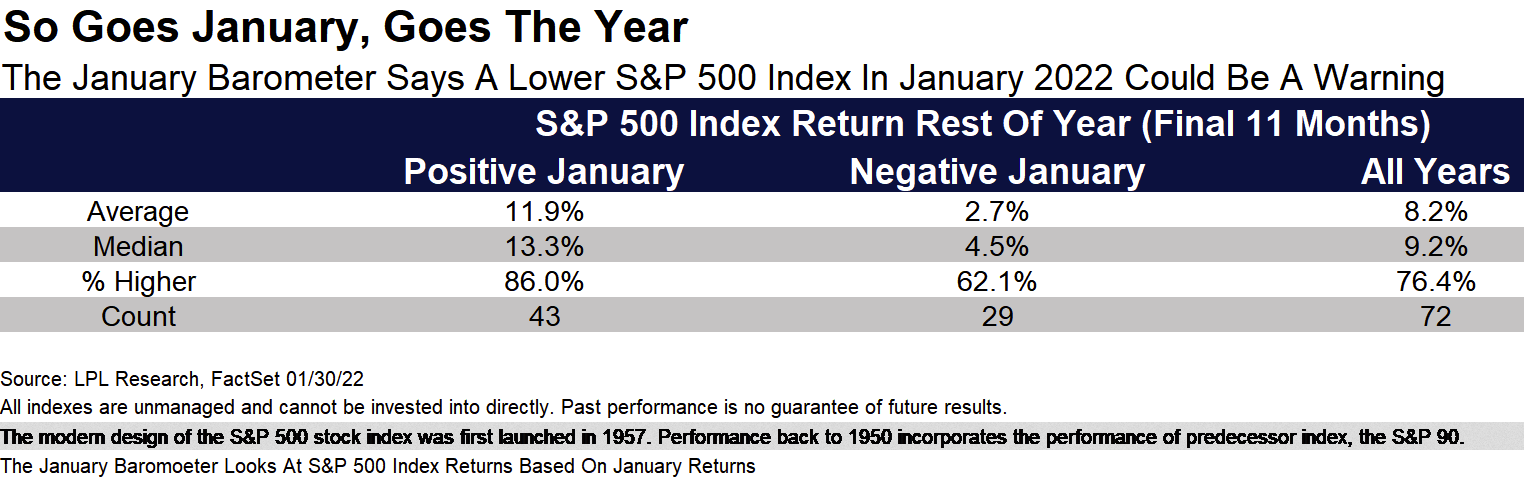
As shown below in the LPL Chart of the Day, the numbers confirm that when the S&P 500 has been green in January, the index has been up 11.9% on average over the rest of the year (final 11 months) and higher 86% of the time. However, when that first month was red, stocks rose only 2.7% on average over the final 11 months and were higher 62% of the time.
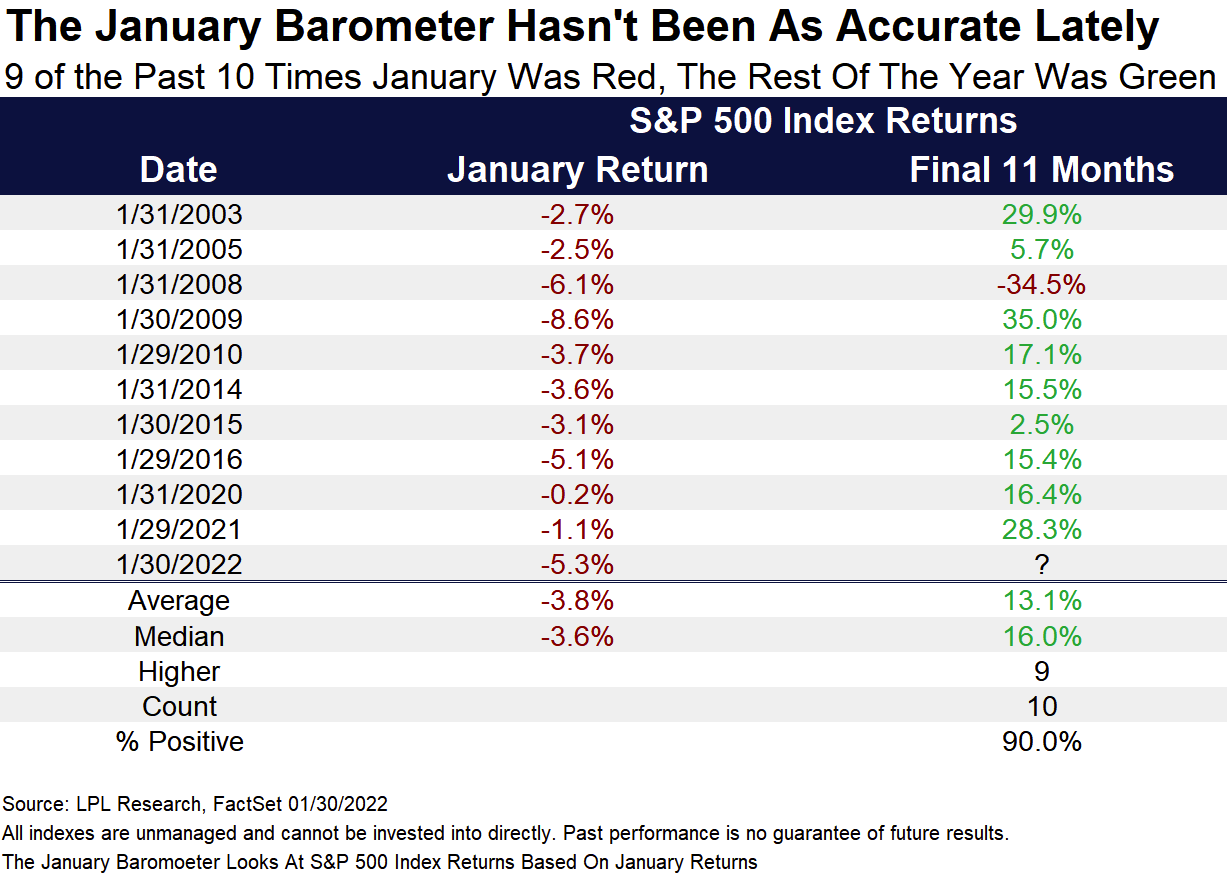
It isn’t all bad news though, as lately the January Barometer hasn’t been working. “Yes, a lower January is a potential worry for the bulls,” explained LPL Financial Chief Market Strategist Ryan Detrick. “But it is worth noting that the January Barometer has been broken lately. In fact, nine of the past 10 times stocks were lower in January, the final 11 months were higher, with some huge gains in there.”
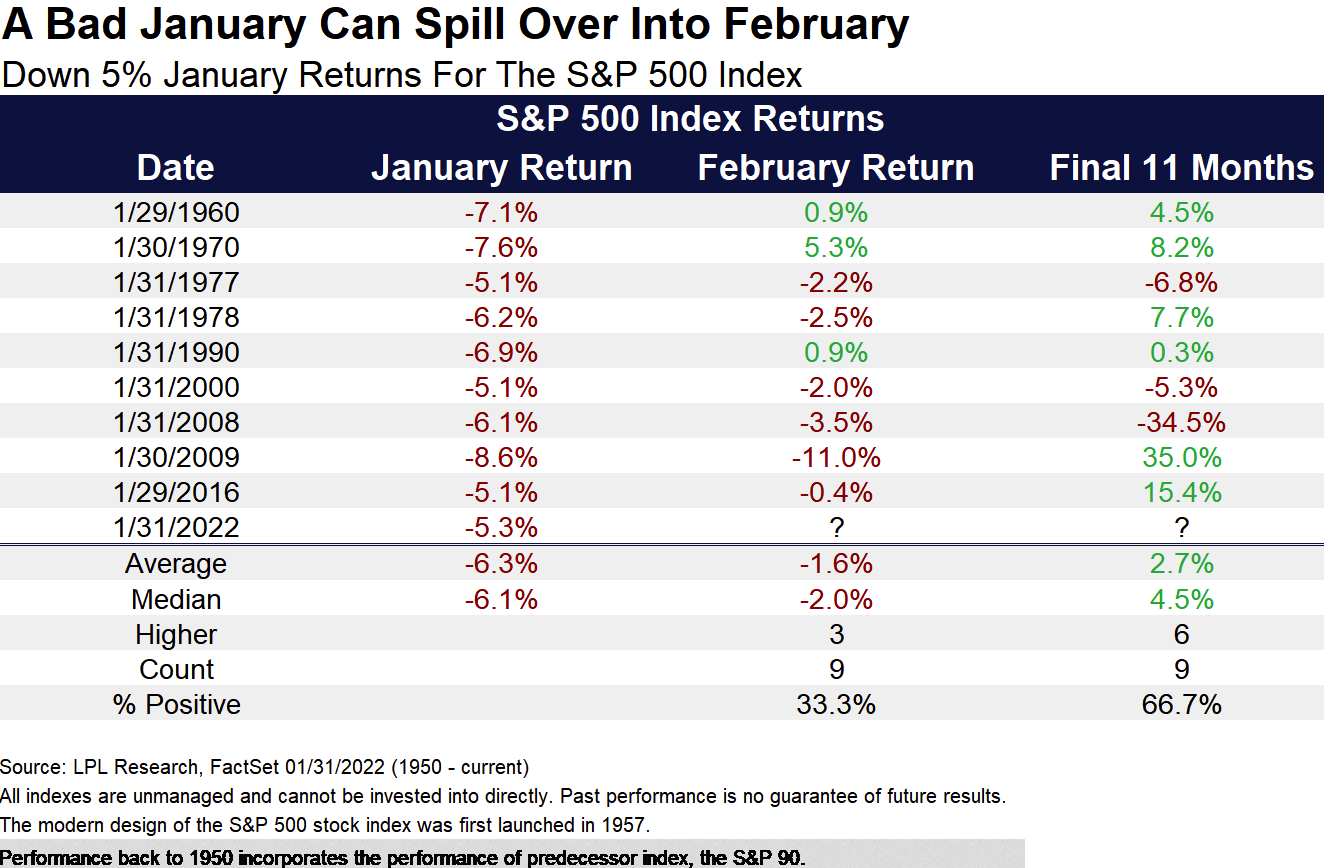
What about if you have a very poor January like we just did? This shows that some continued weakness in February could be in the cards. Here we show that after 5% or greater drops in January, February has been lower six of the past seven times. Longer-term, performance over the final 11 months has been quite muted as well.