


The past couple of years have been a famously tumultuous time for the U.S. labor market—with the steepest employment losses ever early in the pandemic, a rapid recovery and then a so-called Great Resignation that was more about switching jobs than resigning.
Through all of that, the median number of years that American wage and salary workers have been with the same employer didn’t budge. It was 4.1 years in January 2020, and according to job-tenure data released by the U.S. Bureau of Labor Statistics to little fanfare last month, it was 4.1 years in January 2022.
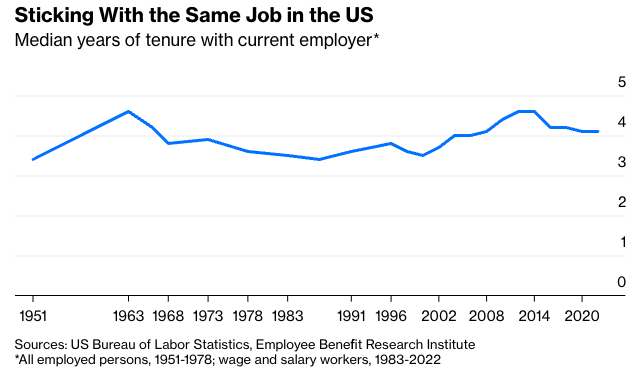
As is apparent from the chart, the amount of time Americans spend in the same job hasn’t changed all that much over the decades either. There are some comparability issues, with current statistics measuring tenure among wage and salary workers while those before 1983 (which I’ve harvested here from a 2019 Employee Benefit Research Institute paper) cover all workers, including the self-employed. But BLS reports from the 1960s indicate that the self-employed, especially the farmers among them, stayed in the same job longer than wage and salary workers did, so if anything, the pre-1983 tenure estimates are overstated compared with today’s, and median tenure has risen slightly since then.
Given how frequently one hears that we live in an age of job hopping and unstable employment far removed from the “old model of work where you could expect to hold a steady job with good benefits for an entire career,” this is perhaps a surprising result. The tenure statistics don’t quite show that such claims are entirely wrong, though.
For one thing, higher job tenure doesn’t always equate to more job stability or security. In a recession when many people are laid off and there are few new hires, median tenure will actually rise because only the people who still have jobs are counted. And in a strong labor market recovery, all those new hires drive tenure down.
Beyond these cyclical effects, placid overall job tenure numbers can cover up some pretty interesting currents under the surface. Here, for example, are the occupational groups that experienced the biggest increases or decreases in tenure from 2020 to 2022.
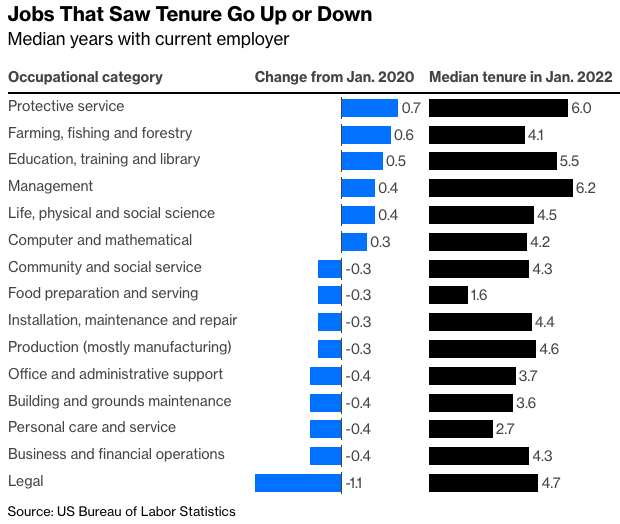
Local governments are struggling to hire enough police officers, firefighters and schoolteachers, and that’s being reflected as rising median tenure. In the occupations where median tenure is falling, a mix of job switching and hiring growth is probably driving the change. The rise in quits that prompted talk of a Great Resignation was concentrated in low-paid fields such as food service, where median job tenure was already quite low.
Tenure statistics are also available by industry, but the results are a little quirky so I’m going to skip making a chart. Median tenure in petroleum and coal products manufacturing was up by a whopping 4.1 years, while in furniture and related products manufacturing it was down by 1.9 years. Agriculture also experienced a substantial increase, while media and waste management both experienced big decreases. Add it all together, and there’s no change, but that doesn’t mean there were no changes.