Seldom does a dense report from a statistical agency take your breath away, but the latest publication on the United States’ national income accounts from the Bureau of Economic Analysis (BEA) is the exception that proves the rule. The publication, after all, is the BEA’s comprehensive, bottom-up quinquennial reassessment of income, output, and prices going back to the Model-T days of economic activity.
Wading into the review’s details, one finds a slightly improved outlook for medium-term growth. Moreover, the data on personal saving suggest somewhat fewer vulnerabilities and more resilience in the household sector. On the other hand, the review changes nothing concerning the two yawning holes – the twin fiscal and external deficits – in the national accounts.
The report requires economists to revise our view of the US economy. First, two bits of good news. In addition to reporting that real GDP increased at a 4.1% annual rate in the second quarter of this year, output in the first quarter was revised upward somewhat, and this was preceded by considerably more income growth. The net effect does not change the big picture – the US still took six years to dig its way out of the Great Recession – but the growth trend (averaging output and income, which is a more reliable measure of activity than either alone) was faster than previously believed. This is significant because, thanks to compounding, small increases in a growth rate produce large benefits down the road.
Far more important, the extra income was not matched by newfound household spending. In nominal terms, the level of personal saving is nearly double what was reported over the prior four quarters. Relative to disposable income, the personal saving rate is now estimated to be 6.8%, not the 3.2% reported in May. Moreover, the saving rate has been moving sideways, at above 6%, over the past five years, rather than falling precipitously, as was previously thought. The upward revisions go even further back, with the percentage differences between updated and prior data on nominal personal saving in double digits since the mid-1990s.
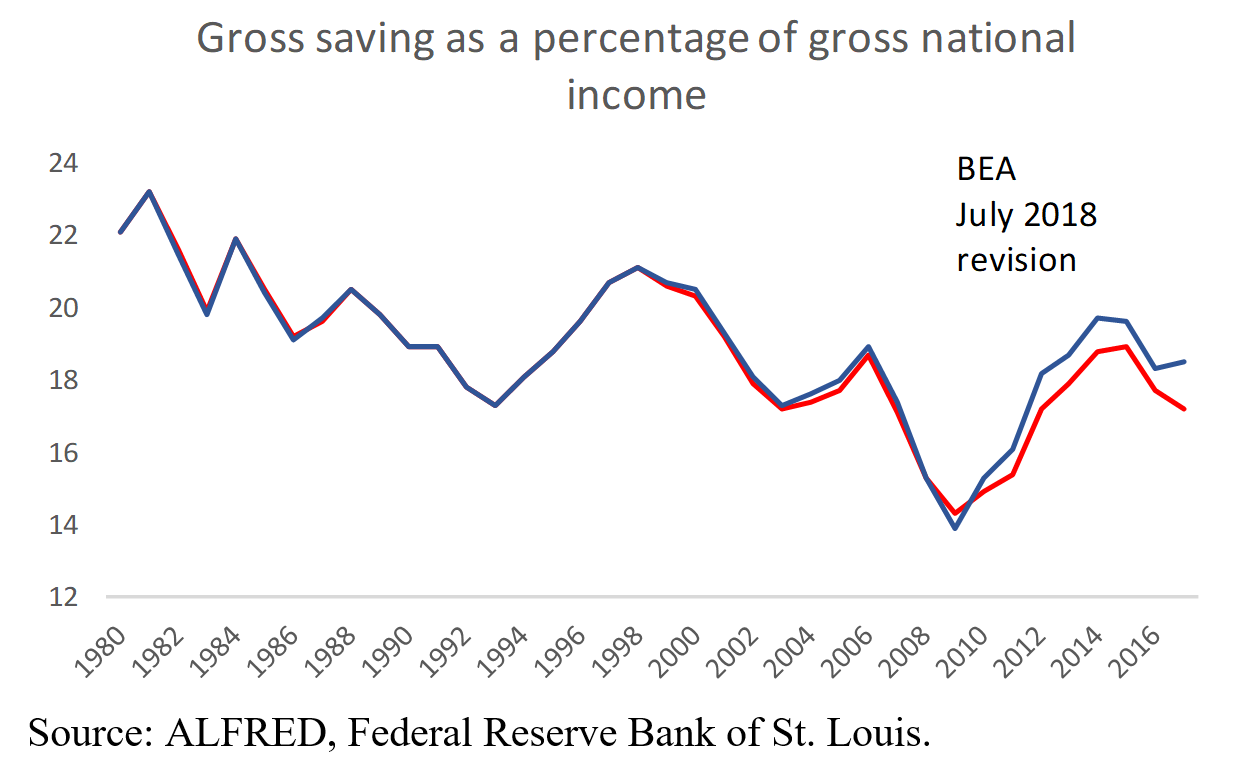
The national income accounts, it seems, have caught up to balance-sheet reality. Since the financial crisis, US households have deleveraged and built up wealth. According to the Federal Reserve, they added about 1.75 years’ worth of disposable income to their net worth from 2008 to 2017. Based on these data revisions, a heftier portion of this wealth accumulation came the old-fashioned way, by consuming less income.
The revision of data for household spending patterns lends support to the economic outlook. If American families are not currently overstretching their paychecks, they have resources to continue to increase their spending. While real growth rates of 4% or higher are not in the immediate future, the US economy will probably expand by 3% in 2018, a pace not achieved in a dozen years.
Economic growth at that pace exceeds the expansion of aggregate supply, straining resource use and prodding the Federal Reserve to continue along its path of gradual interest-rate renormalization. But slowing that pace looks less compelling in light of the new data, which suggest that financial-stability risks should be pushed further down the Fed’s worry list. After all, households that are saving twice as much as previously suspected should be expected to be more resilient when confronted with rising interest rates.
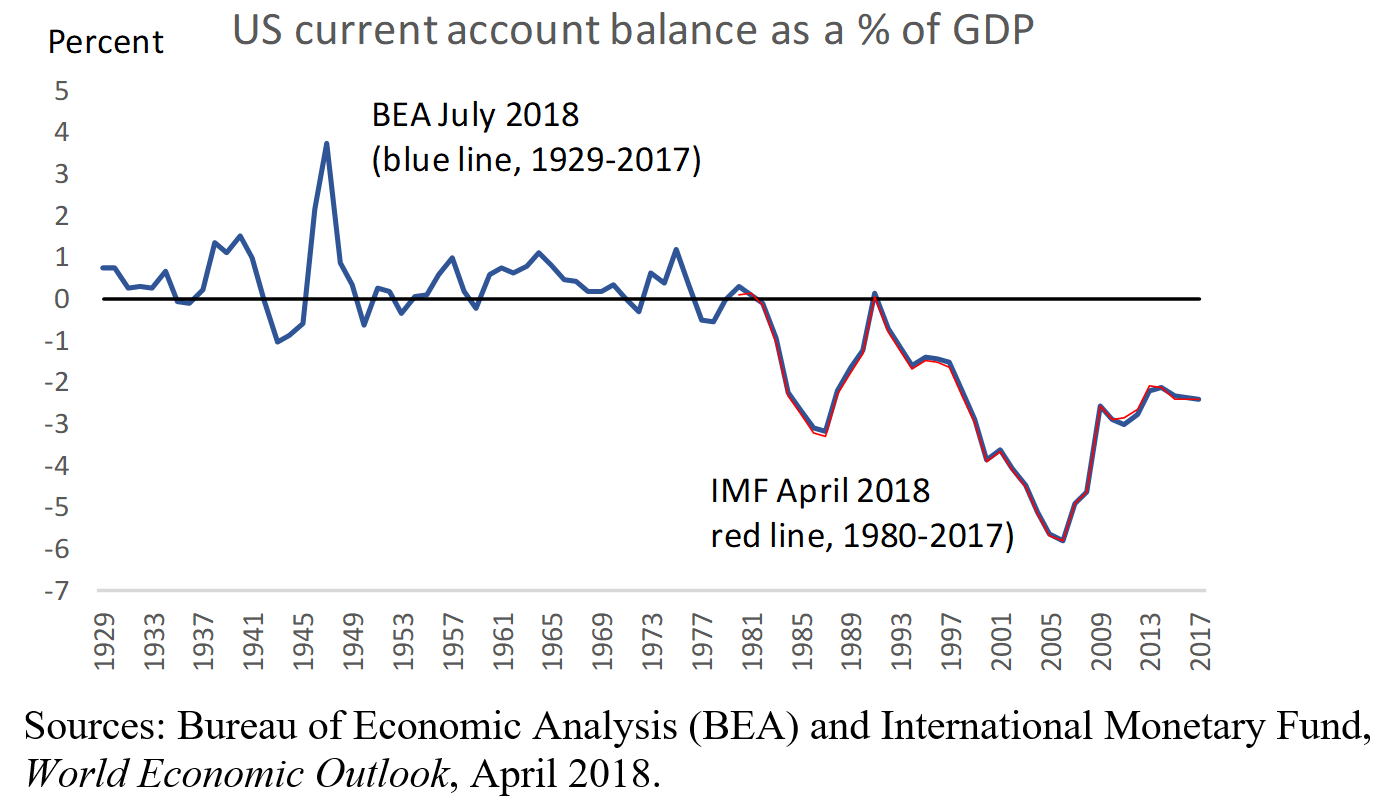
Such resilience will be tested over the longer run, though, owing to the fiscal and external imbalances, which were unaffected by the data revision. Part of the analytical attractiveness of the national income accounts is that they add up. If a country saves more but investment remains unchanged, then it borrows less from (or lends more to) the rest of the world. Its net export position and current-account balance improves.