


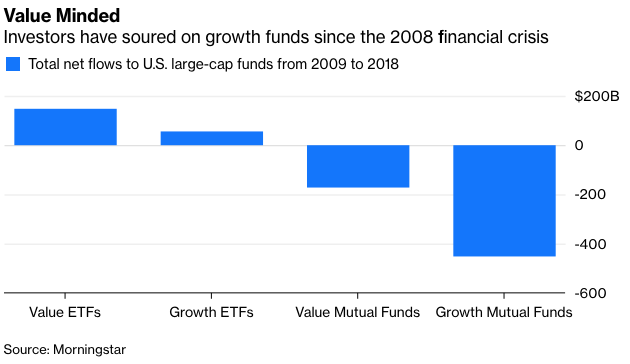
Investors pulled a net $453 billion from U.S. large-cap growth mutual funds from 2009 to 2018, but stock pickers are having the last laugh. I counted 1,084 actively managed funds, including their various share classes, with an average expense ratio of 1.1 percent a year. That fee drag prevented most managers from keeping pace with the growth index, but they beat the all-world index by an average of 3.4 percentage points a year net of their hefty fees over the last decade through February. Only 34, or just 3.1 percent, underperformed the all-world index.
The conundrum is that the results of a few years shouldn’t override decades of evidence, and nothing precludes U.S. growth stocks from enjoying a star turn occasionally. But if they continue to dominate markets, it won’t be easy for investors to persuade themselves to hang on to their new evidence-based portfolios.
This article was provided by Bloomberg News.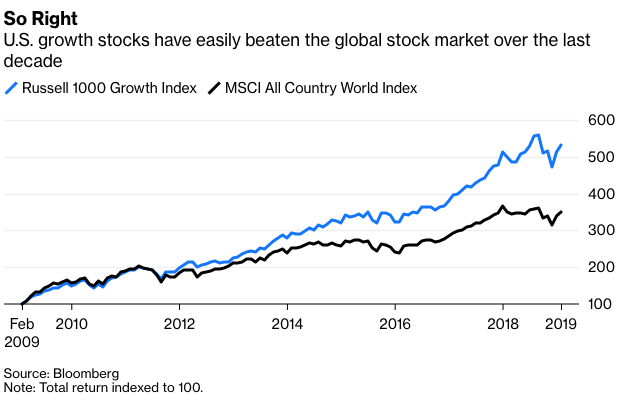
Growth Should Have Underperformed For The Last Decade—It Didn't
March 19, 2019
« Previous Article
| Next Article »
Login in order to post a comment