


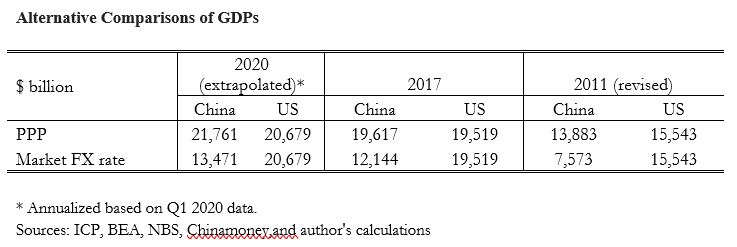
The World Bank’s International Comparison Program has just released its latest measures of price levels and GDP across 176 countries, and the results are striking. For the first time ever, the ICP finds that China’s total real (inflation-adjusted) income is slightly larger than that of the United States. In purchasing-power-parity (PPP) terms, China’s 2017 GDP was $19.617 trillion, whereas the US’s stood at $19.519 trillion.
Of course, when China’s total income is divided by its massive population, the picture changes. Although China’s per capita income has pulled ahead of Egypt’s, it remains in the middle of the pack globally, behind Brazil, Iran, Thailand, and Mexico.
In any case, the two concepts – total and per capita income – each have distinct implications for geopolitics, so one must consider them separately. China wants to be treated like a developing country (at least in trade negotiations), and the ICP’s per capita income figure shows that it is precisely that. But when it comes to power politics and China’s influence in international institutions, total income matters more.
The ICP compares countries on a PPP basis, which is the right method when computing per capita incomes, but potentially problematic when assessing geopolitical power. On the latter question, a better approach would be to compare national GDPs at actual exchange rates, in which case the US economy turns out still to be far ahead of China’s.
When the ICP released its last report six years ago, it created a media flurry, with headlines such as the Financial Times’ “China poised to pass US as world’s leading economic power this year.” Those ICP measures, which pertained to 2011, showed that China’s GDP was gaining rapidly on that of the US. Soon thereafter, it was reported that the crossover had indeed taken place, at least according to national growth statistics interpolated between the six-year ICP benchmarks.
But, again, those findings were based on a PPP reading of the data. The problem, familiar to international economists, is that Chinese and US output are each measured in the country’s respective currency. How should one translate the numbers so that they are comparable?
The obvious solution is to use the contemporaneous exchange rate: multiply China’s renminbi-measured GDP by the dollar-per-RMB exchange rate, so that it is expressed in dollars. Viewed in these terms, the US economy ($19.519 trillion) is still over 50% larger than China’s ($12.144 trillion), according to the latest figures.
By contrast, measuring GDP in PPP terms is more appropriate for comparing standards of living, because it accounts for the fact that many goods and services are cheaper in China than they are in the US. Generally speaking, one RMB spent in China will go much further than one RMB spent abroad. While some internationally traded goods have similar prices, things like haircuts – a service that cannot readily be exported or imported – are cheaper in China than in the US.
The PPP measure has many uses, but assessing geopolitical power is not one of them. It is not helpful in answering the primary question that most commentators fixate on: how China’s economic size and power compare to America’s in the broader contest for global supremacy.