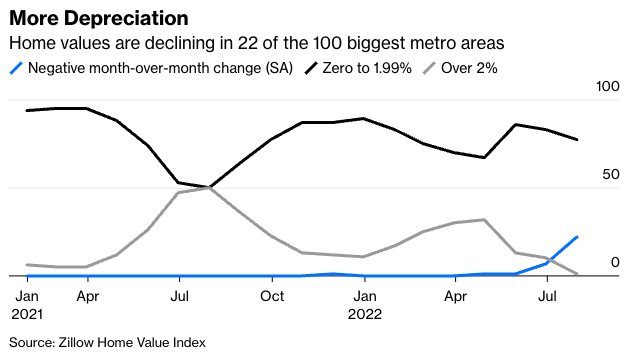
Home price appreciation is slowing fast across the country under the weight of higher mortgage rates, with typical property values even falling month-over-month in about a fifth of major metro areas in July. Clearly, the slowdown is necessary if Federal Reserve policy makers are going to cool inflation and restore affordability to the housing market. The challenge is to prevent the deceleration from becoming a collapse, but monetary policy makers have a chance to pull it off, provided unpredictable outside forces cooperate.
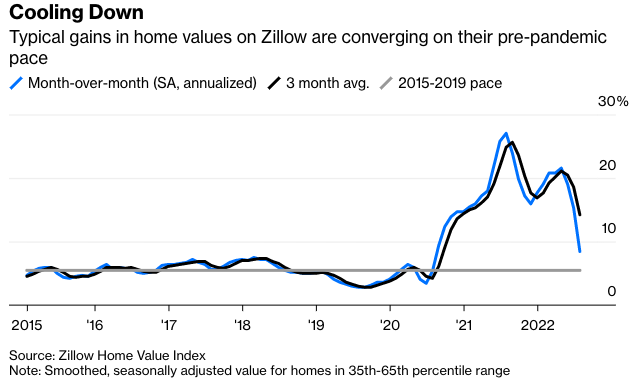
Nationally, typical home values rose a seasonally adjusted 0.7% last month from June, according to the Zillow Home Value Index data released Friday. That’s consistent with 8.5% home value appreciation on an annualized basis, a considerable downshift from a pace of around 25% in mid-2021. The Fed is coming in hard and fast on the 5% pace that was common in the five years before the pandemic, which would finally be consistent with its goal of bringing inflation back under control.

But will the market stop on a dime when it hits that 5% pace, or at least avoid going negative? Ultimately, that all depends on the evolution of inflation broadly; the Fed’s determination to push interest rates higher; and whether policy makers end up driving up unemployment in the process. The odds of a positive outcome look marginally better in the light of recent data.
Home prices aren’t directly part of the inflation index because housing is considered an investment instead of a consumer good. Instead, the main U.S. inflation indexes track a concept called owners’ equivalent rent, which is supposed to capture the cost homeowners would incur if they had to rent back their homes. As a consequence of the quirky methodology, shelter inflation is closely correlated with housing market metrics, but it tends to lag market prices by many months.
The U.S. received encouraging news on Wednesday when the consumer price index showed tentative signs of easing inflationary pressures. Core prices—which exclude volatile food and energy—rose just 0.3% month over month, a 3.8% annualized pace. Without the lagged shelter component, core inflation would have been up just about 0.1%, or about 1.7% annualized. That adjusted version of core inflation may be the gauge to watch in months ahead, especially if the Zillow housing index continues to converge on the target of around 5%.
Of course, one month doesn’t make a trend, and Fed policy makers probably need to see a couple other inflation reports like Wednesday’s to change their approach. Another disruption in energy markets that sends oil and gasoline prices higher would mean all bets are off. Any such outcome would certainly lower the chances that housing prices will escape from this tightening cycle without some scars.

Meanwhile, policy makers are navigating treacherous territory. Look no further than California for an example of how fast the momentum can shift from appreciation to depreciation. As recently as March, San Francisco Bay Area home values were still surging, and now declines in San Francisco and San Jose are among the steepest in the country as inventory quickly returned to pre-pandemic levels after a much publicized shortfall. Until last month, the damage had been limited mostly to cities in California, plus Austin, Texas; Seattle; and Ogden, Utah. But monthly home value declines have now engulfed 22 of the country’s 100 largest metropolitan areas. They include Denver; Boise, Idaho; Phoenix; and Pittsburgh.


