


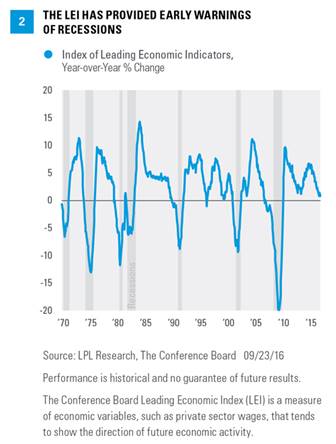
Among the Five Forecasters, the Conference Board’s Leading Economic Index (LEI) provides the best snapshot of the overall health of the economy. The LEI is an aggregate of 10 diverse economic indicators that have historically tended to lead changes in the level of economic activity, including data on employment, manufacturing, housing, bond yields, the stock market, consumer expectations, and housing permits.
The year-over-year change in the LEI has also provided an effective warning signal that the economy might be nearing a recession. When the year-over-year change has turned from positive to negative, a recession has followed in anywhere from 0–14 months with an average lead time of 6 months.
The year-over-year change in the LEI as of August 2016 was +1.1% [Figure 2], suggesting a continuation of the economic expansion that began in 2009. The pace of annual increases has slowed, but that is due mostly to what we view as temporary factors. Should this indicator weaken further and the weakness persist, we would become more concerned. (Look for more on this indicator in this week’s Weekly Economic Commentary.)
Treasury Yield Curve: No Warning
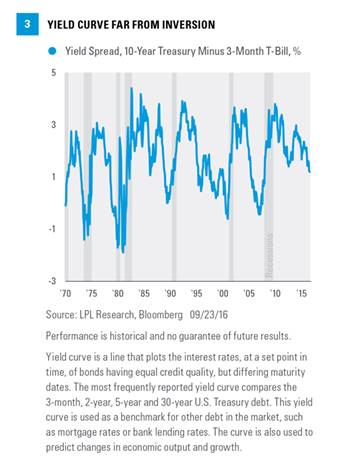
Bull markets have historically ended (and bear markets have begun) when the Federal Reserve (Fed) pushes short-term rates above long-term rates. This is referred to as “inverting the yield curve.” For example, the S&P 500 Index peaked in 2000 and 2007 when the 3-month to 10-year Treasury yield curve was inverted by about 0.5% (3-month Treasury yields were about 0.5% above the yield on the 10-year Treasury note).
In fact, every recession over the past 50 years was preceded by the Fed hiking rates enough to invert the yield curve—7 out of 7 times—a perfect forecasting track record. The yield curve inversion usually takes place about 12 months before the start of the recession, but the lead time ranges from about 5–16 months. The peak in the stock market comes around the time of the yield curve inversion, ahead of the recession and accompanying downturn in corporate profits.
With the 3-month Treasury and 10-year Treasury currently yielding 0.17% and 1.62%, respectively, the Fed must push up short-term rates by nearly 2% to invert the yield curve by 0.5%. Following the Fed’s updated guidance from the conclusion of its two-day policy meeting on September 21, 2016, the Fed does not expect to raise its federal funds rate above 2% until early 2018, suggesting this reliable indicator may not provide a worrisome signal anytime soon [Figure 3].
Some have suggested that the Fed’s zero interest rate policy makes the yield curve a less reliable signal. Using the 2-year Treasury yield (0.75%) instead of the 3-month rate to reduce the Fed impact still provides a benign signal, with more than five rate hikes of 0.25% each required to push the 2-year yield 0.5% above the 10-year at current levels. Even using the 5-year yield (1.16%) would require more than three rate hikes, which may also not come until 2018.
ISM Survey: On Watch