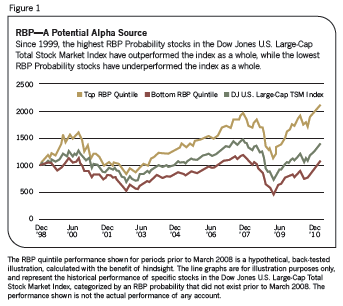
Since the weights are chosen by the manager, index fund proponents argue that the selection process itself is a form of active management. The fundamental indexers counter with the observation that their indexes historically outperform the capitalization-based indexes for statistically significant periods of time. "Our index weights are our alpha," they will say.
Taking the approach that index weights can be alpha, the New York financial services firm Transparent Value (owned by Guggenheim Partners), has developed a proprietary approach to equity valuation that is incorporated into both the Dow Jones RBP Indexes and Transparent Value's own mutual funds and investment products. Unlike the first fundamental index funds, which used widely available measurements such as earnings or dividend yield as the indexing criteria, the Transparent Value indexes use a proprietary valuation metric called "required business performance probability" or RBPP.
A Different Approach
In conventional equity valuation, analysts model the stock price using the future projections of dividends, earnings, discounted cash flow, etc. If the current stock price is below (or above) the modeled price, the analyst pronounces the stock undervalued (or overvalued) and suggests buying and selling accordingly. The RBP model does not attempt to model the stock price, Koski states, but instead "estimates whether management [can] deliver performance to support the price." So instead of buying undervalued stocks and selling overvalued stocks based on future projections, Transparent Value buys companies whose business performance will likely support the stock price. At the same time, it avoids companies where business performance is unlikely to support the company's stock price the way it is currently valued.
But whether one is predicting a company's future stock price based on its projected financial performance or estimating the likelihood that it will maintain its current stock price, one is still attempting to predict the future. The distinction is that RBP does not attempt to estimate future stock price returns, only the probability that the current stock price will be sustained. In that sense, it is aimed at avoiding underperforming stocks rather than identifying outperformers.

Index Performance And Additional Results
Transparent Value has licensed the RBP probabilities analysis to Dow Jones for its RBP Indexes. There are currently more than 20 indices with historical index data going back to 1999. Transparent Value has also launched seven mutual funds based on the Dow Jones Large-Cap RBP indexes. An additional 20 investment products are available for institutional and separate account investors in both long-only and long-short portfolios managed by Transparent Value.
The firm provides advisors free access to its analytics at www.transparentvalueadvisortools.com. Here, the firm applies the RBP lens to different stocks, mutual funds, ETFs and other major equity indexes, both currently and historically. A high-powered graphical user interface makes it very easy to search and sort the securities by their RBPP values as well as other characteristics.


