Will the stock market rally continue? That’s a big question right now, and the answer will depend on two things:
• Whether the fundamentals (i.e., corporate earnings) continue to improve
• Whether investor confidence continues to rise, driving valuations higher
The signs on the latter look good. So today, we’ll take a last look at earnings for the fourth quarter of 2016, to see what the results can tell us about the future.
How did we do?
About six weeks ago, I wrote about how I expected the earnings season to evolve. At the time, only 6 percent of companies had reported, and earnings were expected to rise by about 3.2 percent. Based on past earnings misses, I argued that we could come in as high as almost double the projected level.
As of right now, with 98 percent of companies reporting, actual earnings growth is around 4.9 percent, about one-and-a-half times as high as expected. We did indeed get that upside surprise, and I would argue that it has been one of the main drivers of the market’s strong performance so far this year.
What does this mean for the future?
To find out, let’s take a look at how earnings estimates usually evolve over time, using this 2016 chart from Yardeni Research.
In 2016, earnings estimates for each quarter tended to decline in the period up to quarter-end, then rise again to match the actuals. Taking this at face value, we can expect estimates for 2017 to be low for the first quarter, probably around accurate for the second quarter, and too high for the second half of the year. In other words, 2017 estimates are probably still a bit too high.
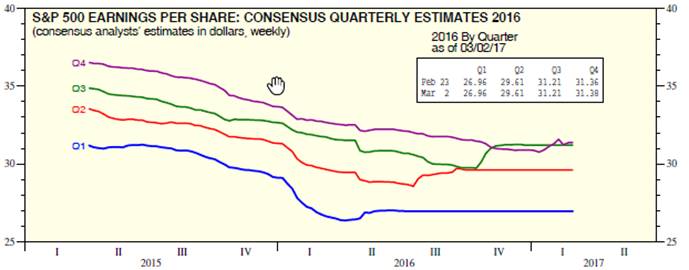
At the same time, note that the upward adjustments got larger—that is, analysts were becoming increasingly pessimistic—in the first three quarters of the year but then calibrated to the new reality in the fourth quarter, with a much smaller upward adjustment. This suggests that analysts are now more in sync with actual performance, and that the 2017 estimates might end up being more on the mark.
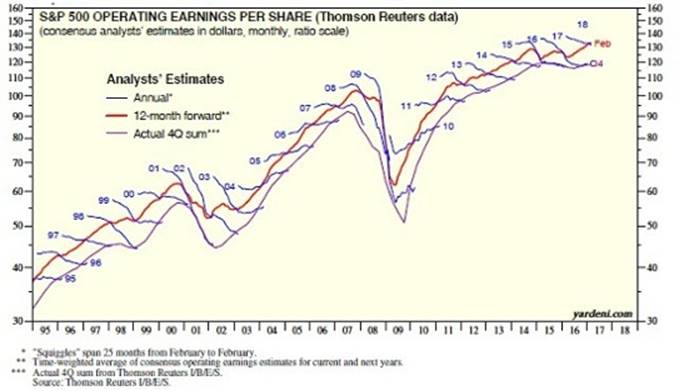
You can see how this works on an annual basis in the next chart. Over the past 20 years or so, analysts have switched from excessive optimism (1995–2003), to moderate pessimism (2004–2006), then back to optimism (2007–2009) . . . only to move to a more accurate approach, despite turbulence (2010–2011), and then back to optimism (2012–present).
In the more recent data, though, we do see that the optimism moderated over what had prevailed in earlier years, suggesting estimates may be more accurate, as we saw with the quarterly data. We also see much smaller adjustments closer to the end, again suggesting that current estimates may be more accurate.
A positive outlook for the rest of the year