Economic data released in the next two weeks will shed light on the state of the housing market as the third quarter of 2016 ended and the fourth quarter began, including reports on homebuilder sentiment for October 2016 (due October 18, 2016), housing starts and building permits for September 2016 (October 19, 2016), and existing home sales for September 2016 (October 20, 2016).
In addition, on October 28, 2016, the data on gross domestic product (GDP) for the third quarter of 2016 will be released, providing the first look at what impact housing had on the overall economy in the third quarter and in 2016 so far. Housing—as measured by residential fixed investment—added 0.3 percentage points to GDP growth in the first quarter of 2016 but gave that all back in the second quarter [Figure 1].
KEY DRIVERS OF HOUSING IN 2016 AND BEYOND
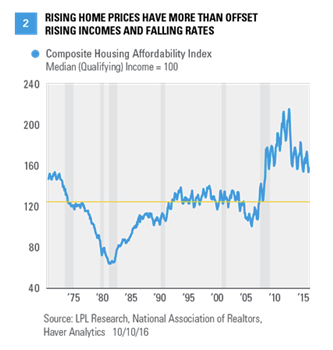
§ Housing affordability. The ability of a household with the median income to afford the payments on a median-priced house at prevailing mortgage rates hit an all-time high in early 2013, before the big run-up in mortgage rates that began in mid-May 2013, as a result of what is now known as the “taper tantrum.” Since then—despite another sharp drop in mortgage rates since late 2013—a combination of rising home prices and sluggish income growth have driven affordability some 25% lower. Although mortgage rates have moved about 100 basis points (1.00%) lower since the end of the taper tantrum, they remain 25 basis points higher than the 2013 lows that preceded it.
Despite the drop, affordability is well above its long-term average [Figure 2] and also well above levels during the mid-2000s housing boom. The three components of affordability—incomes, home prices, and mortgage rates—may all continue to move higher, potentially driving affordability lower back toward its long-term average, but not much below.
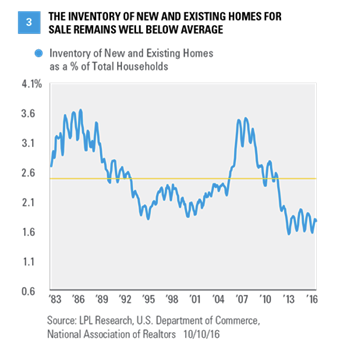
§ Housing supply. At 235,000 units, the number of new single-family homes for sale at the end of August 2016 was well below the peak of nearly 600,000 units for sale in 2006, but above recent lows (140,000–150,000 units). The number of existing single-family homes for sale (1.8 million in August 2016) is 1.6 million units below the peak of 3.4 million set in mid-2007. Combined, the level of new and existing homes for sale remains well below average [Figure 3] relative to the number of households in the economy—and the low level of inventory is likely to be a big factor in driving housing construction in the coming years. We’ll receive an update on both new and existing home inventories (through September 2016) in the last two weeks of October.
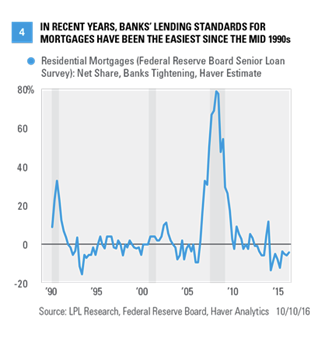
§ Home mortgages supply. From the mid-1990s through late 2006, bank lending standards (required down payments, credit scores, work history, etc.) for residential mortgages were relatively easy. Coupled with low rates and rapid innovation in financial products backing residential mortgages, this easy credit helped to fuel the housing boom. The banking industry began tightening lending standards in late 2006 and continued to tighten standards for more than two years. Lending standards eased in 2009 and 2010, but remained more restrictive than they were in the peak boom years from 2004–06. The latest survey (third quarter 2016) revealed that although bank lending standards for home mortgages tightened a bit between the second and third quarters of 2016, over the past two years, they have been the easiest in 20 years [Figure 4]. The improvement in this indicator in recent quarters is a good sign and may help to offset the recent rise in the rates banks are charging for mortgages. The market will get an update on this metric for Q4 2016, via the Federal Reserve’s Senior Loan Officer Survey, in early November 2016.
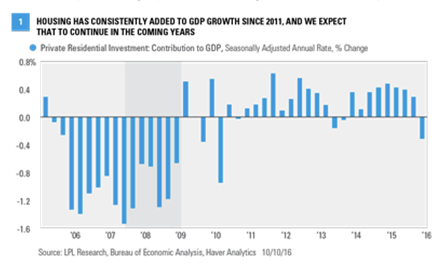
Despite the mixed performance so far in 2016, housing boosted GDP growth in 18 of the 21 quarters since early 2011. Prior to that, between late 2005 and late 2010, housing had been a drag on the overall economy in 17 of the 20 quarters (or five years), as the economy endured the housing-induced Great Recession and its aftermath. We continue to expect (per our long-held view) housing may add to GDP growth in 2016, 2017, and for the next several years, as the market normalizes following the severe housing bust of 2005–10, but we acknowledge, that at under 4% of GDP, housing alone cannot carry the U.S. economy.
Several factors will likely determine the pace at which housing adds to GDP growth in the coming years. Among them are: