


Stocks have had quite a nice run. Since the February 11, 2016 lows the S&P 500 has gained 14%. The rally has been driven by many factors — chief among them, better U.S. economic data, higher oil prices, the Federal Reserve’s (Fed) slower rate hike timetable, increased confidence in China, and more stimulus from overseas central banks. These factors have enabled stocks to trade more on fundamentals than fear, and have pushed the S&P 500 to just 2.4% below its all-time high. Here we assess the likelihood that the rally continues from this point forward, and, if so, how much further it might have to go.
Rare Rally
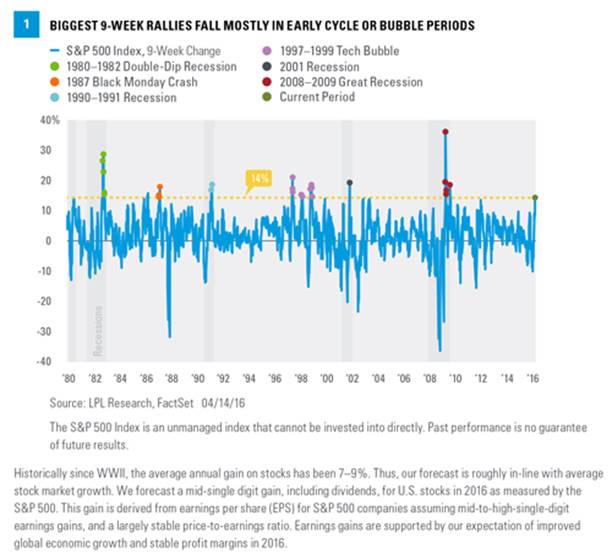
The 14% rally in 9 weeks is not completely unprecedented, but it is rare. Based on weekly data back to 1950, just 1.4% of all the 9-week periods saw the S&P 500 gain more than 14%. So on average, we have less than one of these each year. What is interesting about the history of these sharp rallies is that most of them occurred early in business cycles, shortly after recessions, including 1982, 1991, and 2009–10. Several others could be characterized as crisis recovery periods, including following the 1987 crash and the latest downdraft. We also saw several of these rallies during the tech boom of the late 1990s [Figure 1].
We do not believe the U.S. economy is in the early part of the cycle. Nearing the seventh year of the economic expansion, and based on the business cycle indicators we follow, we believe we are moving into the cycle’s latter stages. That suggests tempering enthusiasm for stocks following recent gains. Some may view a stock market that has more than tripled since 2009 amid unprecedented Fed policies as a bubble, which would certainly be cause for some caution. (We do not share this view at this point but acknowledge the potential for an inflation problem in the years ahead.) Finally, we do not think we just experienced a full-blown, non-recessionary crisis like the 1987 crash or even the 2011 debt ceiling debacle, although it may have felt as bad.
Bottom line, we would characterize this latest volatile market action as more of a mid-to-late cycle recession scare, and we expect the low-return environment stocks have experienced may to continue.
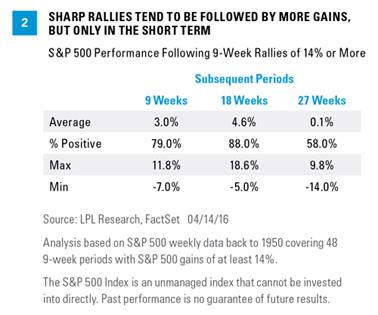
The logical next question is: What have stocks done after these sharp rallies? The answer is mixed. Figure 2 shows that after a 9-week rally of 14% or more, the S&P 500 averages another 3–5% gain over the next 9 and 18 weeks and is higher 79% and 88% of the time, respectively. This is clearly good news for stocks; however, it should be tempered by business cycle considerations. Many of these periods were early cycle when stocks were embarking on significant, extended bull market rallies, or in the bubble period of the late 1990s.
Also note that stock market gains tapered off over the 27-week periods following these sharp rallies, with the S&P 500 roughly flat on average and gains only slightly more than half the time. Each period is different, but this may mean that we could go a bit higher before correcting again and possibly end the year with just a modest gain, as we forecast in Outlook 2016: Embrace the Routine.
Valuations Creeping Up
It is logical to think stocks are expensive after such a sharp rally, but we still characterize valuations as fair. Price-to-earnings ratios (PE) remain near long-term averages, and interest rates are low (interest rates support stock valuations by making bonds less competitive relative to stocks). On a trailing 12-months basis, recent gains have pushed the S&P 500 PE up to 17.5 [Figure 3], about 1 point above the long-term average (post-1980). It is somewhat concerning that prior bull markets have mostly ended at valuations similar to current levels (excluding the 1990s, when the PE approached 30). However, valuations can stay above average for long periods during the latter half of bull markets while stocks are lifted by earnings gains.