


Politicians, who read public sentiment far better than economists do, recognized long ago that people tend to fall back on free-market ideology and insist that open international trade is always good. We haven’t always asked, though, whether free trade helps everyone equally, or at the same time. We also have different definitions of what constitutes “free trade.”
I think confusion on these questions is driving populist trends around the globe. History shows that such movements rarely end well. If we are to avoid a suboptimal outcome, all sides will have to drop their preconceptions and find some common ground.
Common ground does exist. Perhaps I can offer a few ideas about how to search for it.
The Flatline Economy
My May 15th “Life on the Edge” letter drew more feedback and social media shares than anything I’ve done in recent memory. I was commenting on the frustration that drives many people to support Trump and Sanders.
In that letter I talked about Peggy Noonan’s “Protected vs. Unprotected” paradigm. One of her points was that the Protected class is basically considered the elite of both parties.
My friend George Friedman talked about one of his friends who came back from England prior to the Brexit vote and said he had met no one who was for Brexit. That is more a commentary on the social status of his friends than on the actual vote. But exactly the same phenomenon occurs within the Protected classes of both parties: they tend to talk exclusively to one another and so are surprised when there is a wholesale uprising among the Unprotected (who happen to be the overwhelming majority of voters).
Whichever side you’re on (and I freely admit to being well-protected for the last half of my life), it’s hard to deny reality. The last 20 years or so brought great wealth to a few while most of the population was lucky to break even. Here’s an update of Doug Short’s household income chart:
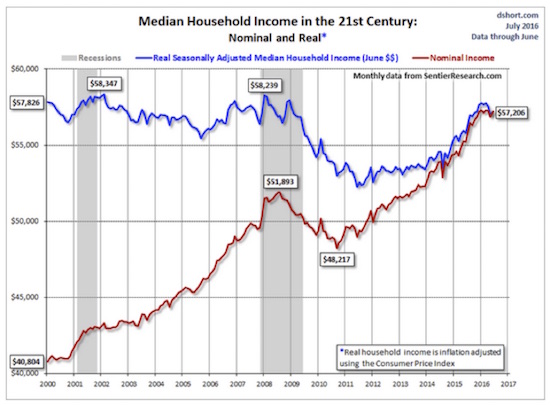
Inflation-adjusted household income (blue line) in the US has gone nowhere in the last 16 years. Notice also that it kept dropping even after we emerged from the last recession (gray shaded area). Further, this is the median, not the average. Half the households earn even less than this amount. Worse, the inflation adjustment is based on the Consumer Price Index, which we know has understated the real cost of living for most people.
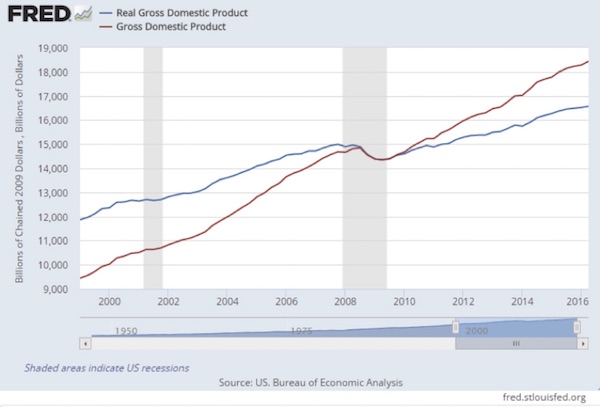
Is income flat because the economy hasn’t grown? In the next chart we have nominal and real (inflation-adjusted) GDP for the same period. Notice that in simple dollar terms the economy has roughly doubled in the past 18 years. Not bad given two recessions, except that after you take out inflation, the economy has grown only a little over 30%, roughly in line with 2%-a-year real GDP growth.
But wait, you say, the previous chart showed median income slightly down since 2000. As Master Po on the TV series Kung Fu would say, “Ah, Grasshopper, you must look deeper.” And if you do, what you find is that GDP growth on a per capita basis – so that population growth is accounted for – is less than 17% since 2000 and less than 2% since the beginning of the Great Recession. 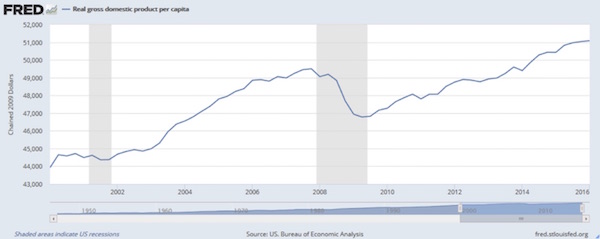
In chained 2009 dollars, per capita GDP was $43,935 in Q1 2000 vs. $51,090 in Q1 2016. So the economy grew over 16% in total, but most households saw little or no income growth. I should note that, omitting immigration, US population is not growing all that much. You can make a case that what little growth there has been in real per capita GDP over the last 10 years is mostly attributable to immigration. Immigrants to the United States and their US-born children now number approximately 81 million, or 26 percent of the overall population. On average, over 1 million people per year immigrate to the US. (I could do a whole letter on immigration. There are just a lot of issues that I can hear readers calling to my attention now. I get them.)