


How can we use this data? Since the Shiller P/E was 29 at the end of the second quarter of 2020, let’s transport ourselves back to the last time it was around that level at the end of the year—in December 2006. At that time, the 10-year U.S. bond yielded 4.71%. It would have been reasonable for investors to expect around 4.71% from their bonds. And their stocks? The Shiller P/E of 27 was one and a half standard deviations above median, implying that there would be 6.07% average annual returns going forward.
We could have said, “I expect 6.07% from my stock portfolio and 4.71% from my bond portfolio.” In that case, the math on expectations of a 70/30 portfolio would have been: 0.70% x 6.07% + 0.30% x 4.71% = 5.66%. Note that the diversification return is generally smaller for shorter time periods, so we would add in 0.32% to account for that (0.32% was the median diversification return for a 70/30 portfolio over 10-year periods as of December 31, 2006). So we add that in and get 5.98% expected average annual returns. Over the next decade, the returns of a 70/30 portfolio were actually 7.11%—pretty close to expectations and certainly far less than the long-term returns of the 70/30 portfolio (which had been 10.67% at that time!) Anyone expecting to obtain the average long-term returns would have been badly disappointed.
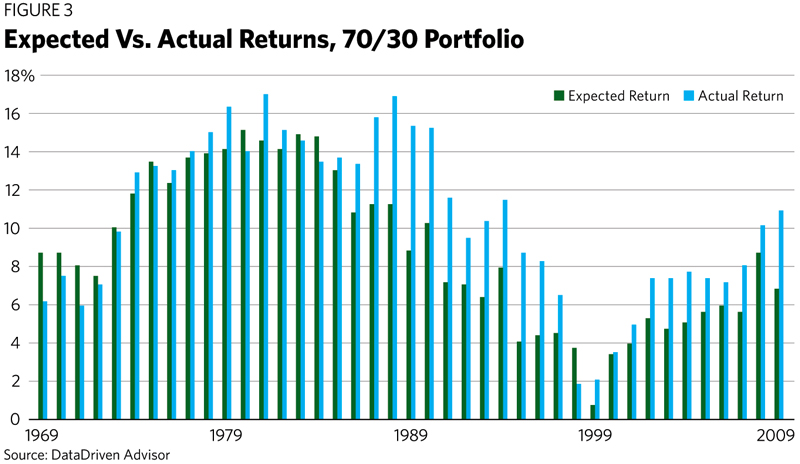
The next chart (Figure 3) shows us the complete historical data set comparing expectations with actual returns since 1970. The expected returns have been between 1% and 15%, while actual returns have fallen between 2% and 17%. Over a decade, returns face an uncomfortably wide range of outcomes, and that range depends almost entirely on the starting valuation. Note that 76% of the time, expected returns fell within 3% of actual returns. When the results did deviate by more than 3%, it coincided with periods of outperformance—during the internet bubble, for instance, or the period ending 2019 (the longest bull market on record). The data is over 85% correlated.
Where We Are Today
As of July 6, 2020, the 10-year U.S. government bond was yielding 0.68%. The Shiller P/E of 29.5 is over 1.5 standard deviations above median. This implies that the average annual returns for U.S. equities will be 4.32% going forward. So today, the math on expectations of a 70/30 portfolio should be 0.70% x 4.32% + 0.30% x 0.68% … or 3.23%.
Add in 0.35% for diversification return (the long-term average, as of early July), and the expectations should be 3.58% for a U.S. 70/30 portfolio going forward. Using the same methodology, the Shiller P/E forecast for average annual returns over the next seven years is an even more disappointing 2.35%. Said differently, over the next seven years, U.S. investors, regardless of their split between domestic stocks and bonds, should be expecting around 2% average annual returns.
Returns of 3.58% are likely not enough for most investors, especially considering that after deducting inflation, the real return is even lower.
So what can we do? Diversify.
Over the last 50 years, a diversified portfolio averaged 9.59%. But the added diversification return averaged 1.12% annually! This is a huge bump in today’s environment of low expectations. Recall, the more diversification you have, the higher your average diversification return.
We’ve already set our expectations for U.S. stocks and bonds at 4.32% and 0.68%. Let’s look at the other pieces of the diversified portfolio.