


With a 5.98% return in June, emerging markets (EM) eked out a 0.29% gain relative to developed markets (DM) after underperforming by 3.07% throughout April and May when economic data was weakening, but major central banks had yet to formally pivot to their current dovish stance.
Coming out of the recent G-20 meeting with no new tariffs and a commitment to kick start China-U.S. trade talks (as well as the support of central banks), investors may want to consider an overweight to emerging markets relative to developed markets.
What We’ve Seen
Even as developed markets lead in 2019, emerging markets hold a modest 0.51% advantage over the trailing 12 months, but it has been a relative performance rollercoaster as investors have tilted between risk seeking and risk avoidance. Most recently, momentum and relative price change suggests that EM is showing strength against their DM counterparts.
Looking at the below figure, emerging markets suffered to a greater extent than developed markets as the trade war escalated. Since then, they have been playing catch up as sentiment has improved.
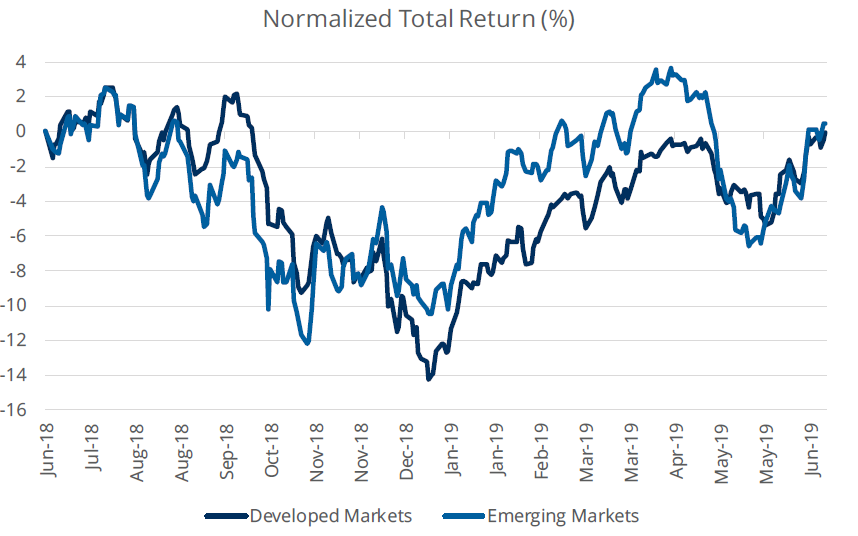
Source: Bloomberg Finance, L.P., as of July 1, 2018 to June 30, 2019. Data displays the total returns of Developed Markets defined as the MSCI EAFE IMI USD Index and Emerging Markets defined as the MSCI Emerging Markets IMI USD Index over the last year. Past performance is not indicative of future results. One cannot invest directly in an index.
Money In Motion
Over the last year, flows into and out of developed and emerging markets ETFs have oscillated markedly just as performance has fluctuated. Relative flows between the pair have ranged from $4.39 billion in favor of DM in May 2019 to $12.27 billion tilted toward EM in February 2019.
Over the most recent month, investors have favored developed markets with $236.36 million of inflows relative to $654.80 million of outflows from emerging markets, with Developed flows in the 25th percentile and EM flows in the 15th percentile. Relative flows are in the 70th category, but off the recent highs that were above the 90th percentile in favor of developed markets for over 20 days from mid-May to mid-June.
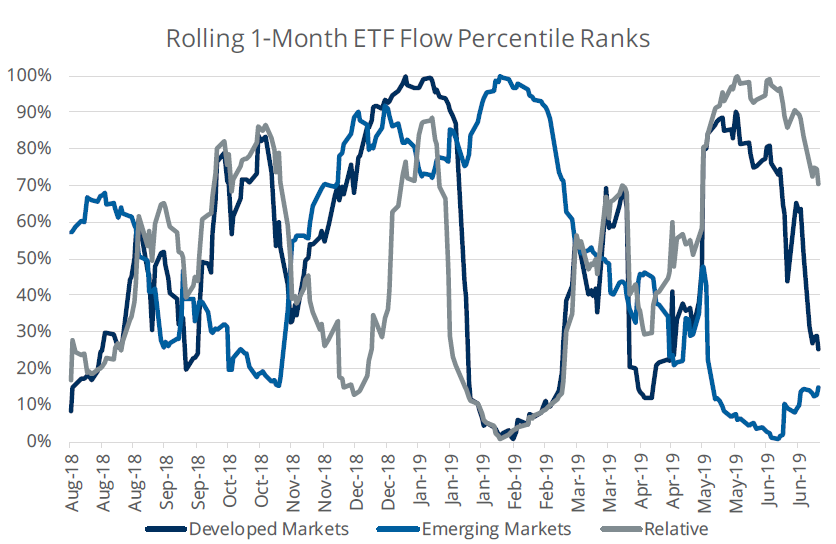
Source: Bloomberg Finance, L.P., as of June 30, 2019. Data represents the daily percentile rank over the last 12-months of the rolling 1-month flows of the U.S.-listed Emerging Markets ETFs and Developed Markets ETFs specifically targeting exposure to broad Emerging Markets and Developed Markets stocks respectively.
What’s Next?
Even with major central banks around the globe providing investors with the backing to take risk, the realities of the continued economic slowdown are increasingly difficult to ignore. The existence of these dynamics may require investors to believe that any deceleration of growth will not come without further help from easy monetary policy.
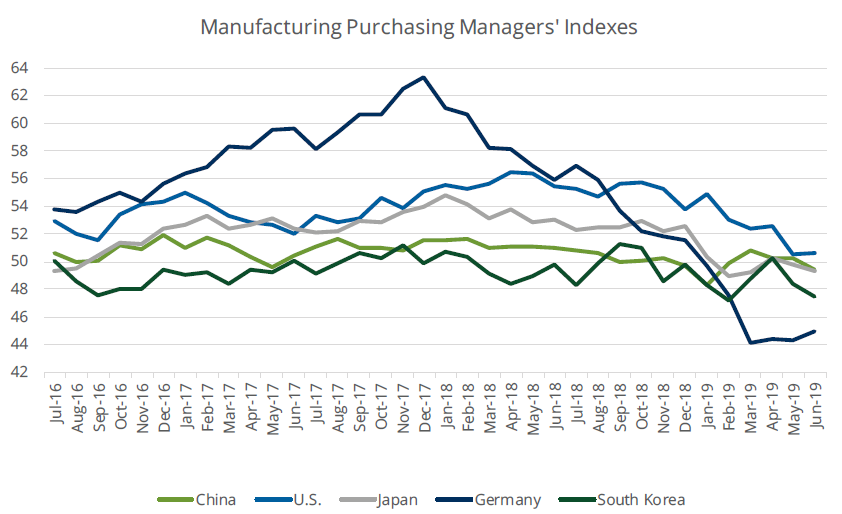
Manufacturing Purchasing Managers’ Indexes (PMIs) data has deteriorated significantly, with PMIs in 4 of the 5 largest manufacturing countries contracting and the U.S. relatively neutral at 50.6. While Germany’s improved to 45.0 from 44.3 in May, manufacturing has been declining every month this year.
Looking forward, the weaker economic data provides cover for further easing, especially from the Federal Reserve that may help to drive down the U.S. Dollar and interest rates, which will help to benefit sentiment.
Source: Bloomberg Finance, L.P., IMS Markit, as of June 30, 2019.
— David Mazza is managing director and head of product at ETF provider Direxion.