Today’s stock market almost appears to be levitating. From January 1, 2017 to January 12, 2018, the S&P 500 Index surged 27 percent, and the ride was remarkably smooth. To put the recent market calm in some context, we looked back in history.
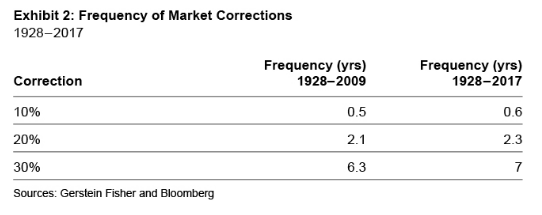
We tallied market corrections of 10 percent, 20 percent and 30 percent by calendar year from 1928 to 2017. We used a “rolling-window” methodology, which works like this: If the market falls 10 percent from its high point during a calendar year, then a 10 percent correction is registered and a new rolling window opens (the first rolling period of each year begins at the start of January). Thus, in a sharply declining market, multiple 10 percent corrections can occur in one calendar year. For example, using this rolling-window method, we counted three 20 percent corrections (Exhibit 1) during calamitous 2008 (recorded on September 17, October 7 and November 20, 2008).
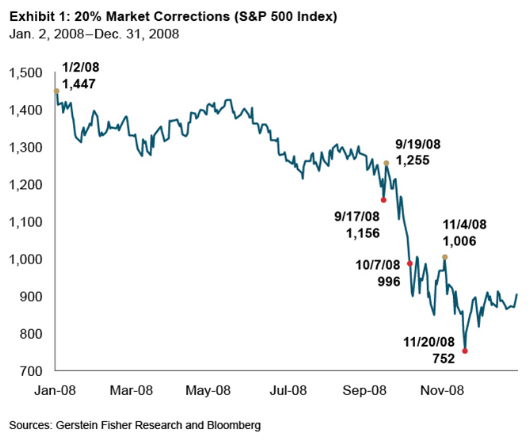
To assess the recently balmy seas, we separated market history into two periods, 1928 to 2009 and 2010 to 2017. During the 82 years from 1928 to 2009, as depicted in Exhibit 2, we counted 155 10 percent corrections, or about two per calendar year; 39 20 percent corrections (roughly one every two years); and 13 30 percent swoons (one per six years).