


Despite the S&P 500 Index starting December with five consecutive days of losses, we think December is down but not out. December often starts slow but historically has been a strong month. There are also some potentially supportive seasonal patterns ahead, such as the Santa Claus Rally, the outlook for January following down years, and the third year of the presidential cycle. ‘Tis the season, and this week LPL Research looks at some important seasonal patterns as the year winds down.
Slow Start To December Not Yet Bucking The Positive Seasonal Pattern
December is off to a rough start, and so far it’s not living up to its seasonal reputation of being one of the best months for equity market returns. Since 1950, the S&P 500 has historically produced average returns of just over 1.5% and has finished the month in positive territory 75% of the time. While the index is down as of Friday, December 9, seasonality trends point to a potential second-half recovery during the month.
As seen in Figure 1, despite the positive seasonal pattern, it’s not unusual for December to get off to a slow start. In fact, we’re near the low point for the historical pattern, and most gains have typically taken place in the second half of the month, although there’s a lot of variation from year to year.
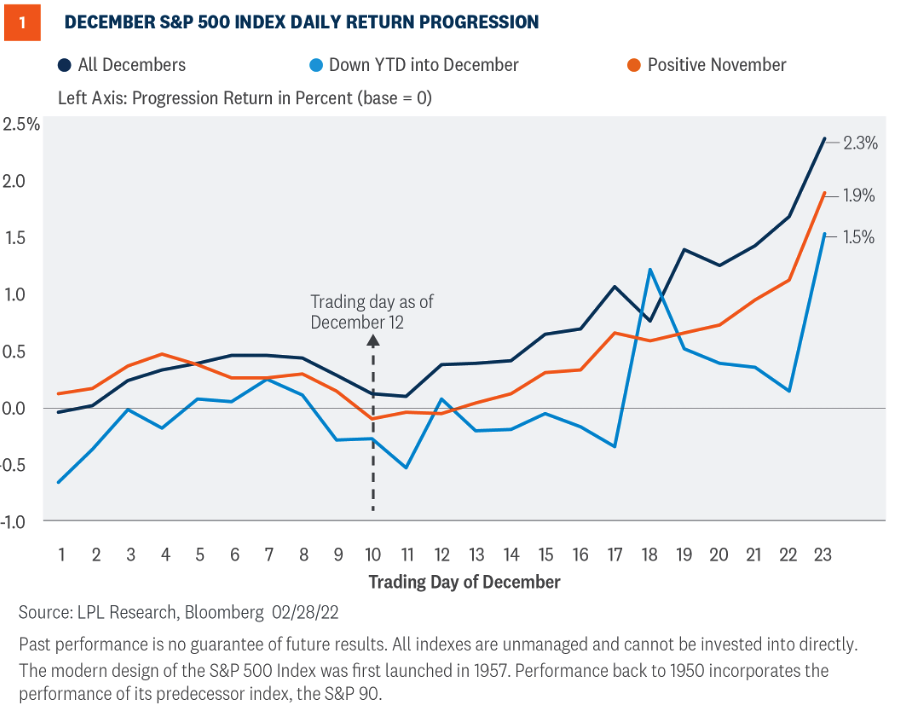
Figure 1 also highlights some added factors that apply specifically to this year, such as how December looks when we’re down year to date as we enter the month and what December looks like after a positive November. Both factors temper our enthusiasm for December strength, but December remains above average even when taking these factors into account.
Santa’s Helper
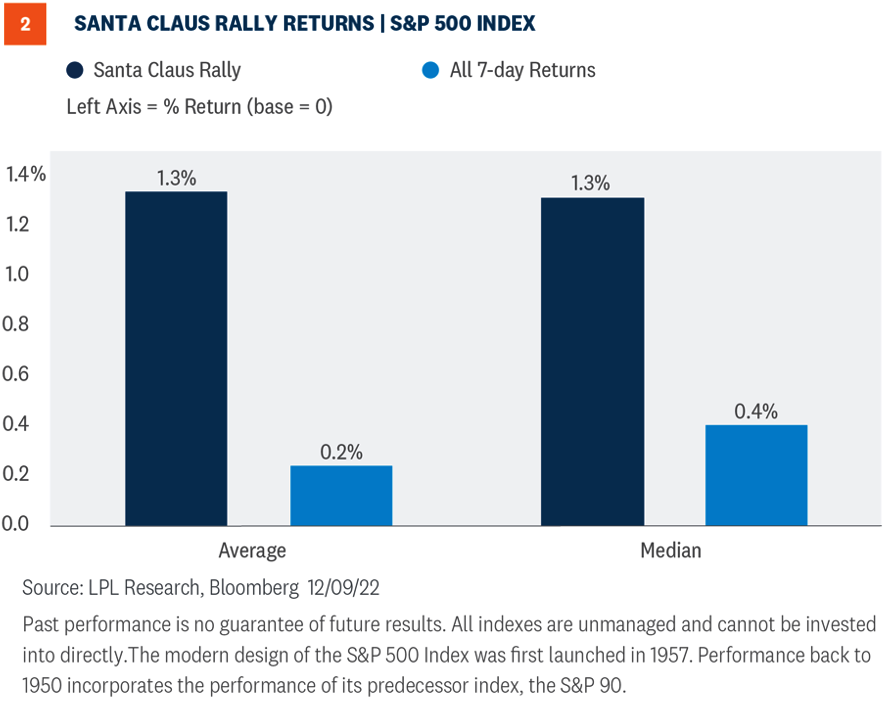
Part of the strong second-half December story is attributable to the market’s tendency to advance during the final trading days of the year and early into the next. This unique seasonal pattern was first discovered by Yale Hirsch in 1972. Hirsch, creator of the Stock Trader’s Almanac, termed the period the “Santa Claus Rally”, which he specifically defined as the last five trading days of the year plus the first two trading days of the new year. The period of just seven trading days is very short, but has historically provided a return comparable to a strong month [Figure 2]. It’s not unusual for stocks to move up (or down) more than one percent even in a single day, but having solid numbers over such a long time period may be meaningful. In any given year, it’s going to be more important factors, such as the economy and the policy environment, that drive returns. However, behind the scenes this period of relatively light volume does seem to provide added support.
How Seasonality Sets Up For 2023
In the near term, of course, we’re not just thinking about the rest of December—January and potential returns for all of 2023 are also front of mind. Here are some forward-looking patterns we’re paying attention to:
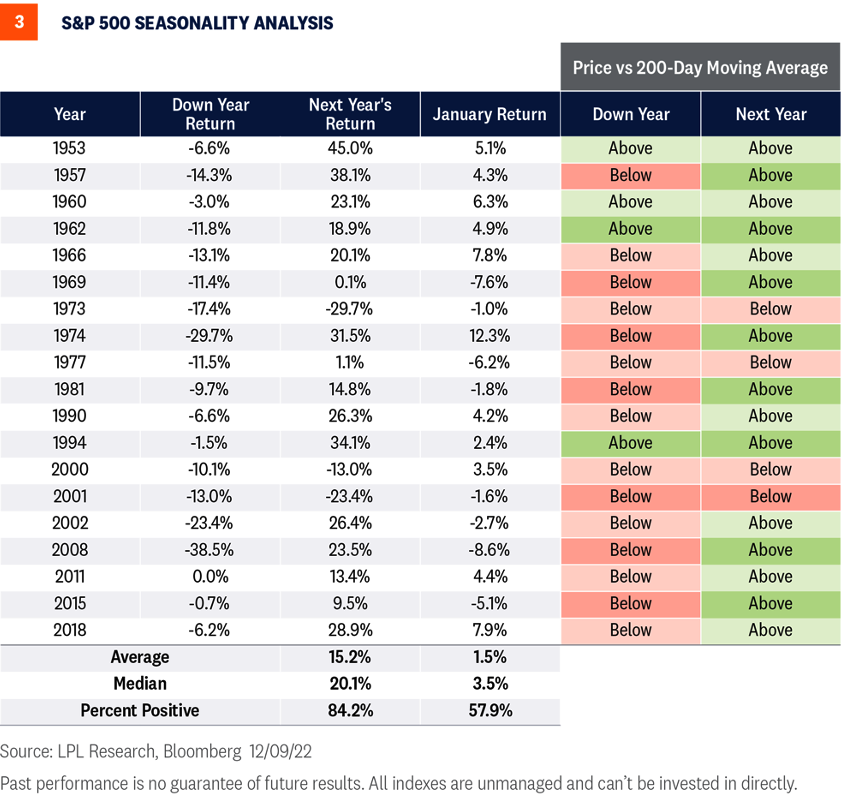
• January returns following a down year historically outperform the average January monthly return for all years going back to 1950 (1.0% on average, 1.5% median).
• Following a down year, the S&P 500 has finished the following year above its 200-day moving average (dma) 79% of the time, compared to down years that only close above the 200-dma 21% of the time.
• The return for the S&P 500 has been above average following a down year, averaging over 15%, but there has been some weak follow-up down years, notably 1974 and 2002.
• We are also entering the third year of the presidential cycle and putting the mid-term election year, the weakest of the cycle historically, behind us. Since 1950, Year Three has averaged 16.8% versus 6.0% for Year Two. The first quarter of Year Three has also been the strongest of the four quarters in the third year.
An Early Happy New Year
We’re now in the homestretch of 2022. It’s been a challenging year for both stocks and bonds as inflation soared, interest rates climbed, and the Federal Reserve executed one of its most aggressive rate hike campaigns on record. Ultimately, the economy, earnings, and the policy environment drive stock returns, not seasonal factors, but seasonals provide an important backdrop. And right now, the outlook based solely on seasonals is about as supportive is it gets (For our broader market view of 2023, see our Outlook 2023: Finding Balance). But even if only a potential small tailwind, we hope the seasonal outlook helps us put a rough year behind us and gives us reason to say an early Happy New Year.
Adam Turnquist, CMT, is the Chief Technical Strategist at LPL Financial. Barry Gilbert, PhD, CFA, is the Asset Allocation Strategist at LPL Financial.