


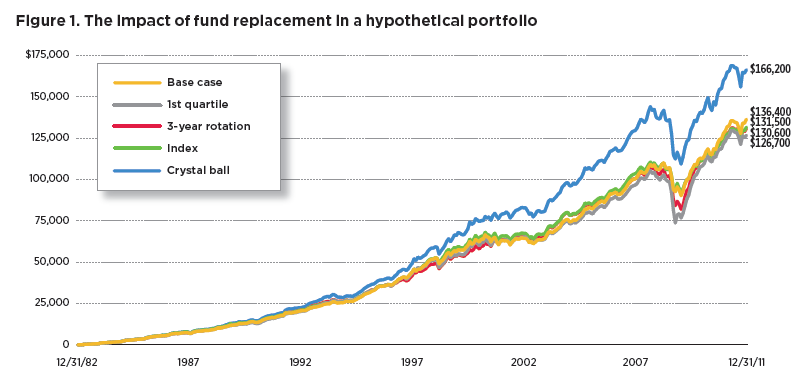
What is surprising is that in the study the best strategy that one could implement was the base case itself, where terminal wealth was between roughly $5,000 and $10,000 ahead of the indexing, three-year rotation, and 1st-quartile strategies. This illustration offers an important caution for those who think that a fund's track record is an indication of its future success. It would sound prudent to put a 1st-quartile strategy in place, or to monitor and manage the lineup so it always made "good" funds available to participants. But when we map out the alternatives, the differences - even over a long time frame - are relatively small, and importantly, changing a plan's underlying funds for justifiable seeming reasons may in fact detract from performance.
2. The Second Driver: Asset Allocation
Turning from investment selection, we look next at the potential impact of adjusting the portfolio's asset allocation. After all, if the base case relies on a conservative portfolio allocation, perhaps a larger allocation to equities and a smaller allocation to fixed-income components could have a meaningful impact on portfolio results, particularly over a time frame of 29 years.
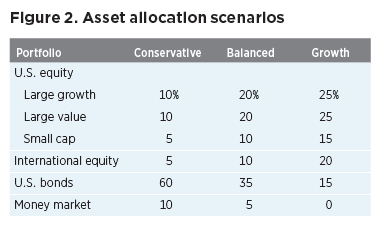
Leaving the 4th-quartile base portfolio in place, we dial up its risk/return profile, taking the asset mix from a conservative model (30% equity) to a balanced (60% equity) as well as to a growth (80% equity) model. Figure 2 breaks down each asset allocation into equity and fixed-income subcategories that map onto the Lipper classifications used in our study.
When we calculate returns for these hypothetical portfolios over our 29-year time frame, it appears that results would be moderately better in both the balanced and growth portfolio models, which returned approximately $14,000 and $23,000 more, respectively, than the base-case portfolio (Figure 3).
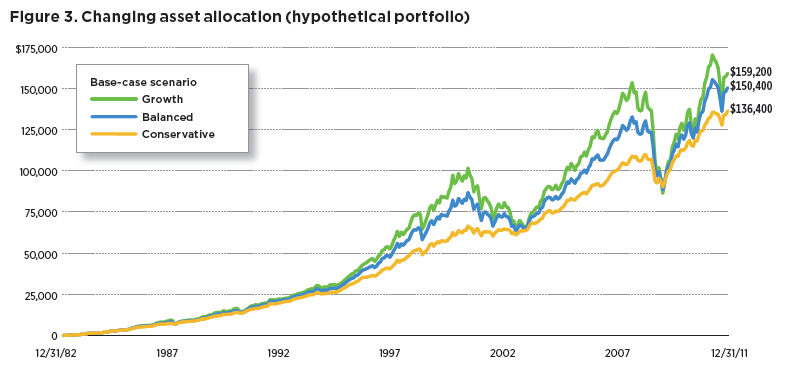
But as Figure 3 demonstrates, these higher returns come with the risk of substantially higher volatility. The conservative
portfolio weathered down-market periods much better than either the balanced or growth portfolio. Thus, while the period in question suggests that asset allocation can be a bigger driver of portfolio returns than the composition of the underlying funds, asset allocation changes carry material risks of severe declines in uncooperative markets.
3. The Third Driver: Account Rebalancing
The third factor we seek to quantify is quarterly account rebalancing. To model this regular portfolio adjustment, we will use the base-case, 4th-quartile conservative fund selection strategy described earlier. We find that rebalancing this portfolio produces slightly greater retirement wealth, but with lower volatility (Figure 4).
Ultimately, a plan is only as good as its ability to keep an investor on track, so producing steadier returns with less fluctuation may help participants stick to their plan. Having said that, the better return/risk ratio in our example does not carry an outsize benefit in terms of absolute annualized return, suggesting it may rank somewhere between asset allocation changes and fund selection in terms of its importance as a driver of longterm returns.
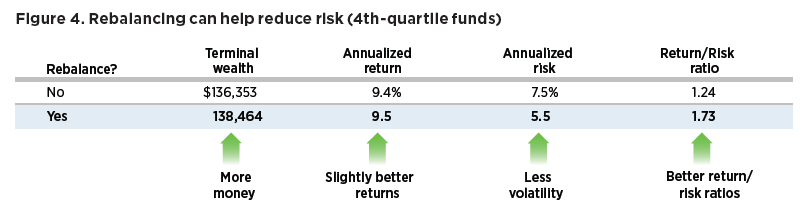
Data are historical and based on hypothetical conservative asset allocation portfolio rebalanced quarterly, outlined in Section 3. Past performance is not a guarantee of future results. More recent returns may be higher or lower than those shown. Investment return and principal value will fluctuate, and shares, when redeemed, may be worth more or less than their original cost.
4. The Fourth Driver: Deferral Rates
Next and lastly, we investigate the impact of higher deferral rates on the individual's wealth accumulation. Very quickly, it becomes clear that the incremental impact of higher deferral rates can be one of the most significant drivers of long-term returns (Figure 5).