


Today’s Points:
• The biggest college endowments have just had a miserable year
• That’s because tracking the S&P 500 was virtually unbeatable
• Long-term, the Yale Model obviously still works
• The question now: Is risk in the strategy as low as it seems, or just hidden in private markets?
• And: China’s stimulus shows it cannot ignore the Federal Reserve
• And: Nvidia’s earnings loom as a big moment—because they really matter
A Weighty Endowment
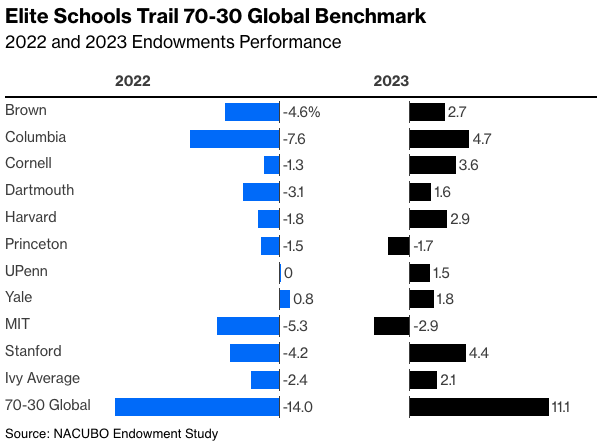
The 2023 fiscal year was great for investors across the world—but not for managers of Ivy League endowments. The numbers in the latest report on universities’ investment performance may not be as bad as they appear at first, but they still leave managers scratching their heads. Somehow, the average Ivy League endowment fund gained only 2.1% in the year to July 2023, compared to 11% in a global 70/30 benchmark (70% stocks, 30% bonds) and an average of 9.8% for the smallest endowments with $50 million or less to invest. That’s enough to raise questions about a strategy that has revolutionized investing—the Yale Model.
After taking over Yale University’s endowment fund, the late David Swensen practically upended how such funds were managed, opting to go with long-term, real assets and minimizing exposure to equities. His idea was that endowments could use their ability to wait for the long term much more effectively in relatively inefficient markets. What followed was a hugely successful experiment that became the gold standard for asset allocation in the endowment world, and increasingly in other long-term institutions, not just the Ivies.
In absolute terms, the average Ivy’s performance in fiscal 2023 was an improvement over the preceding year's, where they lost 2.4% compared to a 14% slump in the 70-30 global benchmark. But none did particularly well; the best-performing school among the elites (made up of the Ivies, MIT and Stanford), was Columbia, which returned only 4.7%.
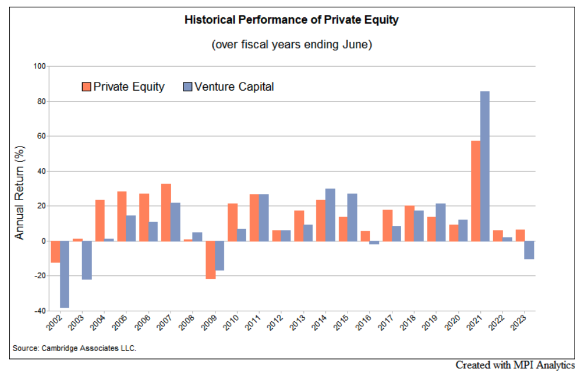
What explains this muted performance? Firstly, venture capital ran into the worst losses since the 2008 financial crisis, with the Cambridge Associates Venture Capital Index losing -10.2%. Meanwhile, the Cambridge private equity index gained 6.2%, marking only the third time since the indexes were established that PE and VC have moved in opposite directions. Both asset classes are popular with Yale Model endowments. Allocations to VC on the downside and PE and public equity on the upside contributed significantly to elite endowment performance dispersion in FY2023, according to Markov Processes analysis:
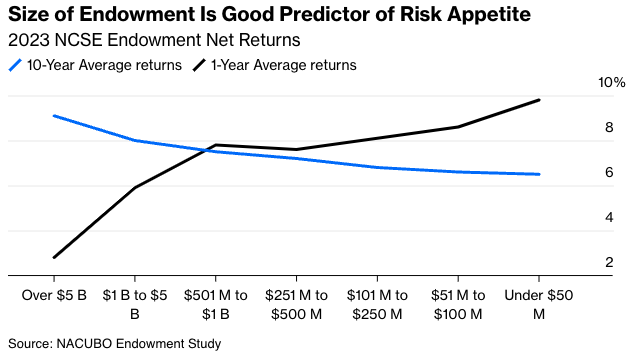
Secondly, this was a year when simply investing in passive funds tracking major indexes of public equities (the strategy that Swensen advocated for anyone who didn’t have Yale’s resources) did really well. The smallest endowments have little practical choice but to follow that approach, which as the chart shows has hurt them in the long run. For 10-year returns, the relationship between performance and the size of the fund is virtually linear; the bigger the fund, the better it does. But over the last fiscal year, that relationship has been turned on its head, with the largest endowments doing particularly badly:
Is the Yale Model broken? Far from that. Ten-year returns continue to be healthy, and if the asset allocations of these elite schools are anything to go by, there is no move away from the time-tested template. The National Association of College and University Business Officers, or NACUBO, shows an increase in allocations to alternative investments to about 55% by the biggest funds, while fixed income’s allocation remained at 19%.
The role of risk in driving long-term performance is never in doubt. MPI analysis concludes, “Over 10-years, Ivy and elite endowments show a very clear relationship between returns and risk-taking; simply put, these endowments appear to be levered versions of a global 70/30 portfolio. All schools exceed the 10-year return of a global 70/30 (+6.8%), with the average Ivy returning 9.8%, but with significantly more risk.”
How great is that risk? With a 12.6% standard deviation based on annual reported returns and an estimated 15.1% volatility based on MPI’s Transparency Lab models, the average Ivy is projected to be almost 50% more volatile than the global 70/30 (10.71% standard deviation). The top performers over the last 10 years, MIT (+11.5% return, 21% modeled volatility) and Brown (+11.3%, 19.8% estimated standard deviation), show nearly double the risk of the benchmark.
This leads to the greatest complaint against the Yale Model—that private markets, only rarely marked to market, effectively conceal volatility. Laundered risk is still risk: Despite the masking of the volatility of private-market assets, a stated benefit of the Yale Model, elite endowments are significantly riskier than a balanced portfolio invested in 70% stocks.
Fiscal 2023, a year when investments in a few large stocks beat all comers, is probably an outlier. Endowments avoided outright losses, and Yale’s model continues to look far stronger on a risk-adjusted basis than its peers. A few more years like 2023 will be needed before key assumptions are shaken.
—Richard Abbey
China Crisis
For years, the great hope for China has been that it will be goaded into a “shock and awe” stimulus that will rally the rest of the world. Some strategists have openly rooted for things to deteriorate so that everyone else can enjoy some Chinese money. But now that something very much like financial thunder has arrived in Shanghai, the world seems a tad underwhelmed. There’s reason.
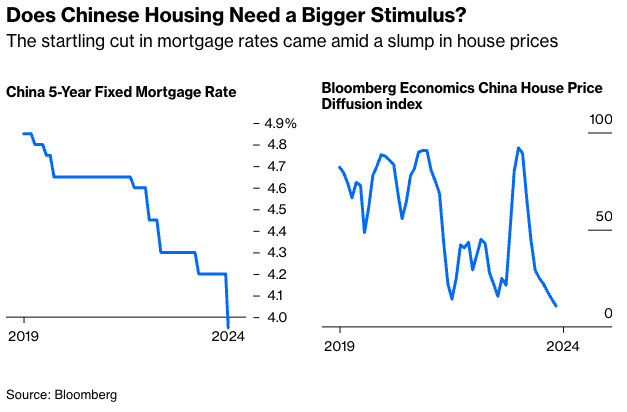
The big move, announced Monday, saw the People’s Bank of China slash the prime five-year fixed mortgage rate by 25 basis points, to just below 4%. Mortgage rates have never been cut by so much before. A look at the situation for the housing market, vital in creating the wealth that prompts Chinese consumers to go out and buy things, shows why shock and awe were in order. Bloomberg Economics’ measure suggests house prices were mired in ever greater negativity:
This follows an aggressive move to reduce the reserve ratio that banks need to keep when making loans, another direct stimulus to lending. But the impact of these moves, taken together, hasn’t been that great. Stocks in Shanghai have risen 2% since the Lunar New Year break, but a rather more dramatic repricing might have been expected.
The currency is a big part of the problem. Twenty years ago, China deliberately held its currency too cheap in a successful effort to flood the world with exports. Those days are long over. At this point, its problem is to avoid the yuan growing too weak. That makes it easier to sell stuff, but in the worsening trade environment it’s more important to maintain buying power. That colored the way authorities chose to administer their stimulus. The mortgage rate doesn’t directly affect bond yields and has minimal impact on foreign exchange, so it was cut sharply. But shorter-term rates, more relevant to foreign exchange traders, didn’t move.
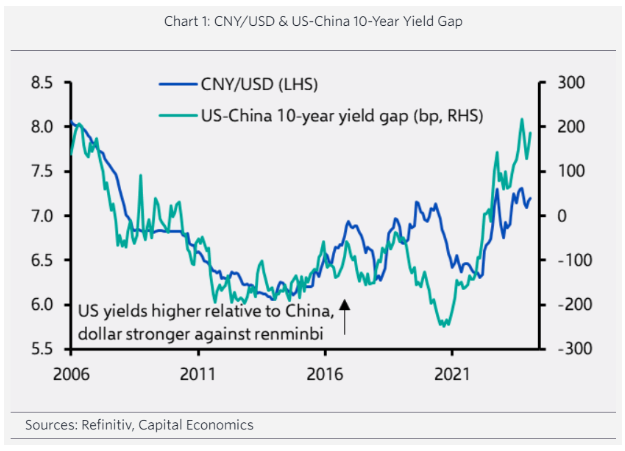
That is because Chinese bond yields are now well below yields available on the dollar. It wasn’t always this way, and this contributes to the weakening dollar. As Capital Economics of London demonstrates in this chart, the exchange rate tends to follow the yield gap, which has grown very wide as the Federal Reserve tightens rates in the U.S.
The problem for China is that it has lost its place as the fulcrum of global macroeconomics. In the first two decades of this century, a move by China would require a response elsewhere, as happened with several one-off adjustments to the exchange rate, and with the epochal fiscal and monetary stimulus it unleashed amid the global crisis in late 2008. Now, it’s constrained by the Fed like everyone else. To quote Mansooor Mohi-uddin, currency strategist at Bank of Singapore:
Once the Federal Reserve reduces interest rates in response to falling inflation, we expect from June, the PBOC will be able to ease monetary policy more aggressively as Fed rate cuts will reduce downward pressure on the CNY. But lower interest rates alone in China will be unlikely to revive confidence in the subdued economy. Instead, further fiscal stimulus and property measures will be needed.
The PBOC’s move can be taken as an unequivocal signal that Chinese authorities are now all-in on supporting the housing market. But the way that move was made shows that it’s now far more beholden to the U.S. than ever before—and that eats away at the case for buying Chinese assets. Even after this not-so-shocking, less-than-awe-inspiring move, China will need to do more to re-energize its economy and stock market.
An Nvidious Position
As Points of Return has pointed out frequently of late, the results from the biggest U.S. tech companies have virtually turned themselves into macro events. Of nobody is that more true than Nvidia Corp., widely perceived to be the chipmaker that will benefit most from waves of attempts to use artificial intelligence. Results are due after the market Wednesday. And it looks like someone is having a fit of nerves.
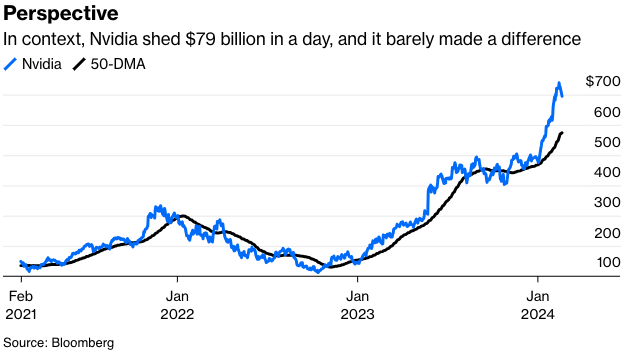
Nvidia dropped 4.4% on Tuesday, shedding $79 billion in market cap in the process, by far its biggest daily fall in market value terms. That is a ridiculous amount of money to disappear on the back of no news, particularly when lots of useful information about the stock is about to become available. Nvidia matters more than it once did, as it has contributed more than any other stock to the S&P 500’s rise over the last 12 months (it alone accounts for 15% of the rise). That said, in context, this isn’t much more than an adjustment, and certainly not yet even a correction. This is how Nvidia’s stock has moved over the last three years, compared to its 50-day moving average:
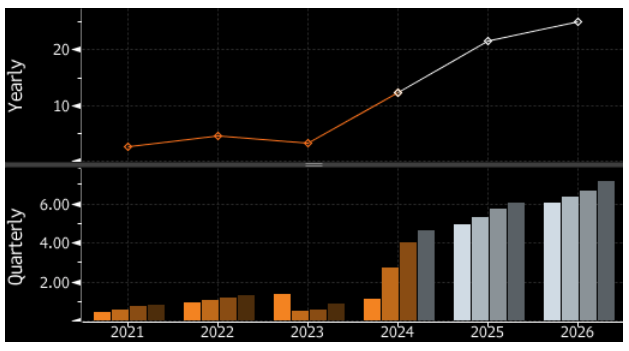
What it does show, however, is that a lot is riding on some very rosy assumptions. The growth in Nvidia’s earnings per share in the 15 months since the debut of the ChatGPT app has been phenomenal. The market is currently expecting growth to continue at a more subdued but still impressive rate. This is how Bloomberg’s earnings forecast function (EEO on the terminal) breaks down the company’s earnings per share since 2021, with actual numbers in brown and projections in shades of gray:
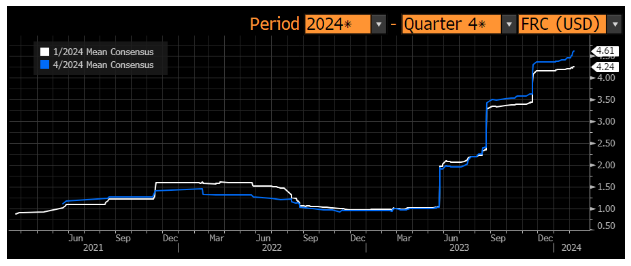
Growth to date justifies a lot of hype. But can we bank on it continuing? If we look at how expectations for earnings per share for the quarter we’re about to hear about, ending Jan. 31, and for the current quarter have evolved, it’s noticeable that they’re still rising. Each of the last three earnings announcements has transformed expectations for the company's future:
Nvidia led an awful day for the chips sector, although the market as a whole didn’t do too badly—the Nasdaq 100 was down only 0.79%. And Tuesday’s nerves create that much more chance of another big bounce if the company manages to trounce expectations once again. The nagging thought is of what might happen if they disappoint.
There’s little point now in speculating. We’ll know soon enough. But the selloff was a useful reminder of just how much Nvidia has contributed to the rally of the last year, and of just how high the hopes are for its future.
—With assistance from Richard Abbey
John Authers is a senior editor for markets and Bloomberg Opinion columnist. A former chief markets commentator at the Financial Times, he is author of The Fearful Rise of Markets.