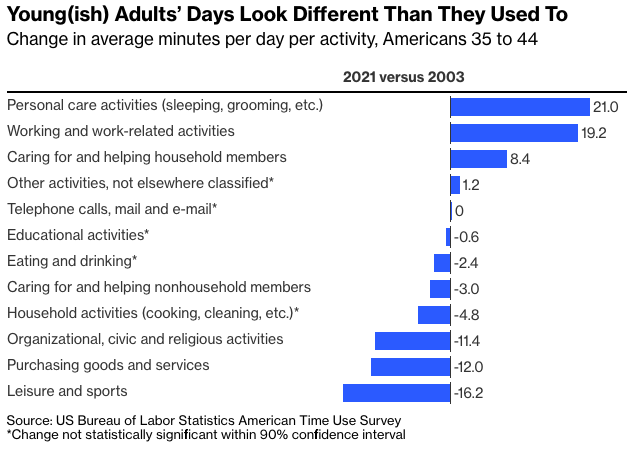
Where did that lost leisure time go? To work, sleep and child care, mainly. Here’s what has happened since 2003 with the 12 umbrella categories into which the BLS divides time use (the numbers should thus add up to zero, but don’t quite because of rounding).
The increase in time devoted to personal care sounds like a positive development, but there are caveats. It’s mostly increased sleeping time, which in the survey’s accounting includes “spells of sleeplessness,” and has been boosted since 2019 by a 4.8-minute increase in “health-related self care” that is clearly due to the pandemic and isn’t a positive development at all.
As for time devoted to work, it includes work-related travel time—mostly commuting—which fell 5.4 minutes from 2019 to 2021 thanks to the pandemic-induced shift to remote work. This means 35-to-44-year-olds’ non-travel-related work time is up nearly 25 minutes since 2003. Meanwhile, the increase in time spent caring for and helping household members was entirely about the kids, who took up 11.4 minutes a day more in 2021 than in 2003 while time spent caring for other household members fell.
On the other side of the time balance sheet there were 12 fewer minutes a day devoted to purchasing goods and services, surely a byproduct of the rise of e-commerce. This effect is apparent across all age groups, although the 35-44 group was tied with 55-64 for the biggest time savings. The decline in time spent on organizational, civic and religious activities, which doesn’t seem like such a great development, is apparent and statistically significant across all age groups except those 65 and older, but is biggest by far among the 35-44 group.
Then there’s leisure time, where this all started. Sixteen lost minutes may not sound like much, but that’s a daily average that works out to 98.6 hours a year. Multiply that times the estimated 43.4 million Americans in the age group as of mid-2021 and you get almost 4.3 billion lost leisure hours last year. Which sounds like a lot.
As is apparent if you eyeball the chart showing the age group’s leisure time through the years, the losses have come mainly since 2012. What could have caused this? My guess is that it’s been an after-effect of the nation’s economic woes during and immediately after the Great Recession, when most of those now aged 35 to 44 were in their 20s and just getting started on adult life. Trying to get started, that is: The terrible job market forced many to go back to school, move back in with their parents and/or delay buying homes and starting families. They’ve been playing catch-up ever since, which has wrought a certain amount of havoc with their daily routines.
On the positive side, this could portend a leisure-time recovery for future 35-to-44-year-olds who didn’t face such economic crosswinds in their 20s. For now, though, it means that those in that age group really are especially pressed for time. So be kind to your local 35-to-44-year-olds. Maybe even offer to babysit.
Justin Fox is a Bloomberg Opinion columnist covering business. A former editorial director of Harvard Business Review, he has written for Time, Fortune and American Banker. He is author of The Myth of the Rational Market.