


Earlier this year, the Federal Reserve Bank of Cleveland published a paper, “Do Longer Expansions Lead to More Severe Recessions?” by Murat Tasci and Nicholas Zevanove. It contends that the “forest fire” theory isn’t supported by evidence; nor is it necessarily true that longer expansions are followed by severe recessions. In fact, the authors assert, the length of the current expansion is actually tied to the strength and depth of the Great Recession that preceded it. They rely in part on Milton Friedman’s “plucking” model, which suggests the economy is like a tight string that gets plucked down from time to time by myriad disruptive forces. The size of the pluck (or contraction) can predict the size of the ultimate reversion (or expansion) to normal output levels.
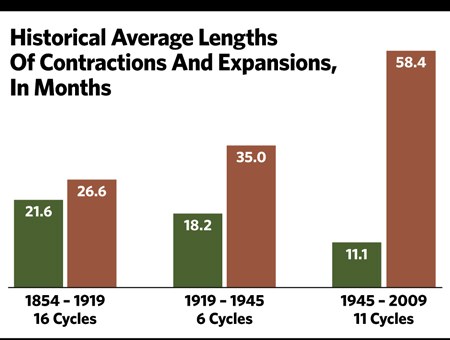
Further support can be found for this latter line of reasoning by comparing the historical average lengths of the contractions and expansions that have occurred since 1854 (as reported by the National Bureau of Economic Research). If anything, the trend is that U.S. economic expansions are lasting longer, while economic contractions have become substantially shorter in duration.
Also, while the current expansion has been long by historical standards, the recovery in GDP has been relatively shallow. This could allow for an even longer expansion.
Gauging Severity
But we should discuss the parameters for what makes a recession mild or severe. The National Bureau of Economic Research has vaguely defined a recession as “a significant decline in economic activity spread across the economy, lasting more than a few months, normally visible in real GDP, real income, employment, industrial production and wholesale-retail sales.” Based on this definition, we could think of severity in terms of duration, or we could think of it in terms of depth, likely measured by the magnitude of GDP contraction or by losses in income, employment, production or sales.
These measures do matter. They affect people, businesses, communities, the country and the entire world in a variety of largely negative ways. But the reality is that, in the modern age of streaming information, 24-hour news cycles and interconnected markets, almost everybody (except economists) measures the severity of recessions primarily by the health of the financial markets. Consider the recession of 1973-1975. While it was protracted in length, it saw only a minimal decrease in GDP. Yet, because of the extreme bear market associated with this recession, many think of it as among the worst ever.
 The same can be said of the recession of 2001. By most measures, this recession, which followed a 10-year expansion, was relatively mild. It lasted for eight months, had little impact on GDP and saw only a slight decline in employment. Yet it will forever be associated with the bursting internet bubble and the subsequent dramatic losses experienced by the financial markets.
So let’s imagine the next recession in terms of the financial markets. Since 1946, the S&P 500 has suffered through 11 bear markets, which, for this purpose, we will define as a 20% or more decline. Almost all of those bear markets were tied to economic recessions, and their average peak-to-trough decline was about 34%. Averages, however, can be misleading. If we take the three worst markets out of the calculation, the average decline was only 27%. These three extreme bear markets—which we’ll call the grizzlies—were each associated with a recession but shared characteristics absent today. There was a 48% decline associated with the recession of 1973-1975, a 49% decline associated with the recession of 2001 and a 56% decline associated with the Great Recession of 2008-2009. What differentiates these three periods from others is that, in 1973, 2001 and 2008, the U.S. economy experienced an irregular buildup of harmful imbalances that led to and exacerbated the ensuing recession. In the case of the two most recent recessions and associated bear markets, the irregularities primarily took the form of bubbles in the internet and housing sectors. An external shock inflamed the more distant recession of 1973-1975—a sharp rise in oil prices resulting from the oil embargo launched by the Organization of Arab Petroleum Exporting Countries (OAPEC).
1973-1975 Recession
According to the National Bureau of Economic Research, the recession of 1973-1975 lasted from November 1973 to March 1975. While in most cases no one factor ultimately triggers a recession, the 1973 oil crisis was a leading catalyst for the start and longevity of the recession of 1973-1975. In October of 1973, OAPEC launched an oil embargo that lasted for about five months. The embargo and following rise in oil prices acted as a catalyst for the recession that would officially start the very next month. This external shock aggravated other recessionary symptoms and plunged the U.S. financial markets into one of their worst downturns on record. When it was all over, that recession led to the worst post-Great Depression stock market in nearly 30 years.