There’s a little more to it than that, though. If anything, gold seems to have fallen by more than might have been indicated by the rise in real yields. Other factors explain this.
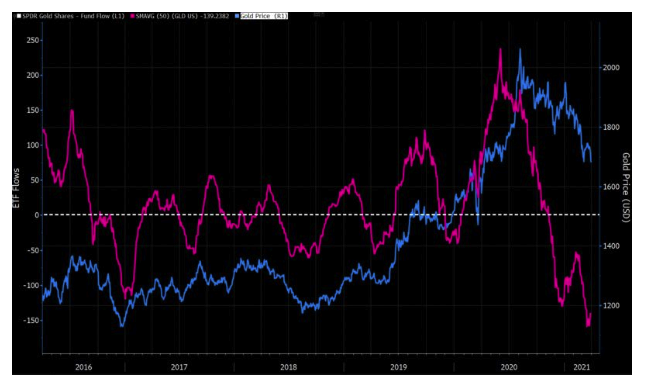
Investor demand, especially through the exchange-traded funds beloved by retail investors, is ever more important. After heavy inflows during the Covid shock to the iShares gold ETF generally known by its GLD ticker symbol, investors have started to yank cash in a big way. The chart shows the gold price in blue, against the 50-day moving average for fund flows into GLD. The outflows appear to have had a big impact:
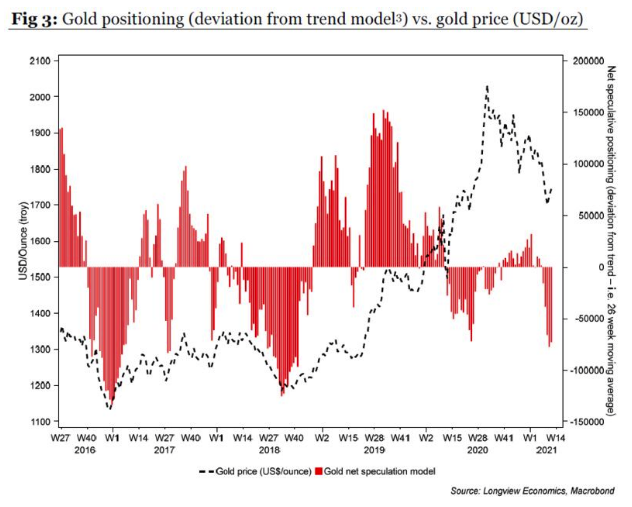
If we look at futures positions, we similarly see a sharp turn against gold in recent weeks. The following chart from Longview Economics Ltd. of London looks at variations from the trend, to account for the fact that gold positioning tends always to be “long.”
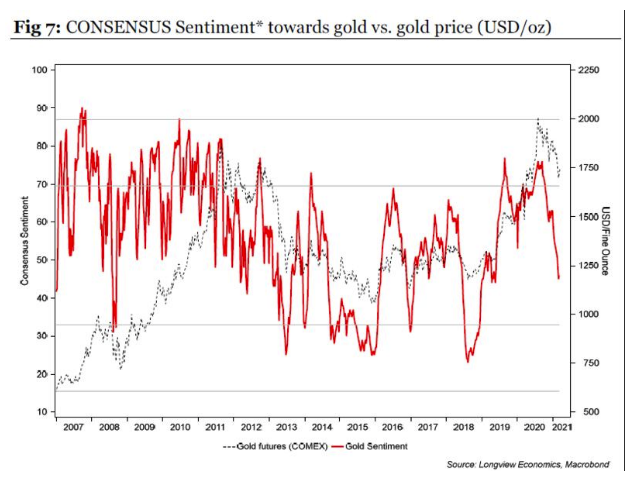
Longview also shows that investor sentiment around the outlook has turned much more negative, using data on consensus predictions of big institutions collated by Consensus Inc., a research group. It is now at levels that are typically bullish for the future price:
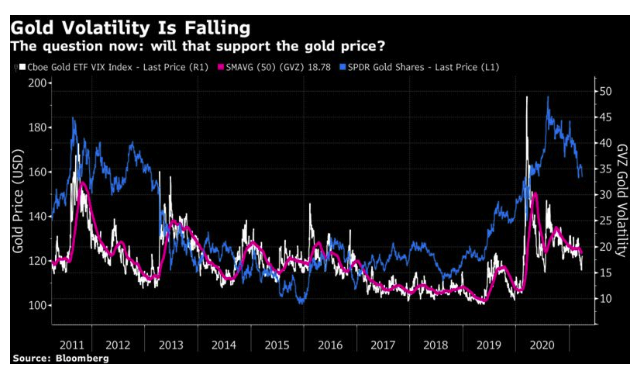
Another potentially bullish sign is the fall in volatility, measured by activity in the options market for gold ETFs in the same way that the VIX index for equities is measured. Calmer conditions probably create better prospects: