


Do Decision Makers Need To Understand The Transmission Mechanism?
It is quite possible that corporate decision makers do not understand the relationships that cause QE and forward guidance to redirect resources from real investment to financial investment. It is also equally likely these executives do not understand that this process reduces economic growth, impairs productivity and hurts the rise in wage and salary income. But, does a lack of understanding of economic theory by key market participants render the causal relationships invalid?
Spence and Warsh elegantly argue corporate executives do not need to know these fundamental relationships. Here is their key passage: “ Market participants may not be expert on the transmission mechanism of monetary policy, but they can deduce that the central bank is trying to support financial asset prices. The signal provided by central banks might be the essential design element.” Real assets market participants simply need to know that the central bank does not offer such protection. In other words, the corporate managers merely need to realize that one asset group is protected and the other is not.
The Asymmetric State of Monetary Policy
Our assessment is that monetary policy has no viable policy options that are capable of boosting economic activity should support be needed. In fact, the options available to the central bank, at this stage, are likely to be a net negative. This, however, does not mean that conventional and tested monetary operations that are designed to restrict economic activity and inflation are ineffectual. In fact, standard restraining operations remain effective. Monetary restraint may even be more effective than historically because of the extreme debt overhang of the U.S. economy. The increase in short-term interest rates that the Fed has thus far achieved is small, but public and private debt stands at 375% of GDP, far above the historical average of 189.4% from 1870 to 2014. Thus, the higher cost reverberates much more significantly through the U.S. economy.
The extremely high level of debt suggests that the debt is skewed to unproductive and counterproductive uses. Debt is only good if the project it finances generates a stream of income to repay principal and interest. There are two types of bad debt: (1) debt that does not generate income to repay interest and principal (Hyman Minsky, “The Financial Instability Hypothesis”); and (2) debt that pushes stock prices higher without a commensurate rise in corporate profits (Charles P. Kindleberger, Manias, Panics and Crashes). When the composition of debt is adverse, less flexibility exists for the end users of the debt to absorb the higher costs engineered by the Fed. Even if this is not the case, the small increase in the federal funds rate serves to shift both money growth and velocity downward, which has the effect of weakening nominal GDP at a time when it is already slow and decelerating.
Prior to the Fed’s December rate hike M2 grew at annual rates of 5.3% and 5.6%, for the three and six month perods, respectively. Subsequent to the Fed’s change in policy, three conventional monetary influences have turned more restrictive. First, in the reserve maintenance period ending January 6, the monetary base, as measured by the Federal Reserve Bank of St. Louis, dropped $258 billion, versus the reserve period immediately prior to the Fed rate hike. Consequently, the base was at the lowest level since October 2013, when the Fed was still executing QE3. The base, as measured by the Federal Reserve Board, registered a slightly larger contraction of $294 billion. Second, the Federal funds rate rose by about 0.25%, from roughly 0.125 to 0.375%. Third, the short to intermediate Treasury note yields rose relative to the ten-year and thirty-year Treasury security yields. Thus, the yield curve between the two-year and ten-year Treasury notes as well as the between the two-year note and thirty-year treasury bond flattened considerably.
All three of these actions will, in time, serve to lower M2 growth and reduce the velocity of money. The absorption of reserves places downward pressure on M2 growth, while the higher short-term rates encourages households and businesses to minimize transactions balances. The higher short- and intermediate-term yields encourage households to save a little more by spending less. The flatter yield curve reduces the earnings potential of the depository institutions, which, in turn, reduces the lending directly and M2 indirectly. Thus, the Fed tightening could serve to push M2 annual growth toward 5% or below. If velocity continues to remain in the persistent 3% downward trend, nominal GDP’s growth rate could fall to 2%, a third lower than in 2015. This leaves little room for a sustained acceleration in either real growth or inflation.
The flatter yield curve is also a reliable leading indicator of economic activity, as well as the above-mentioned source of monetary restraint. A rise in short-term rates relative to the long ones is an indication that investors expect economic activity and/or inflation to fall in the future. Such an expectation is consistent with the likely trends in M2, velocity and nominal GDP.
Treasury Bond Yields
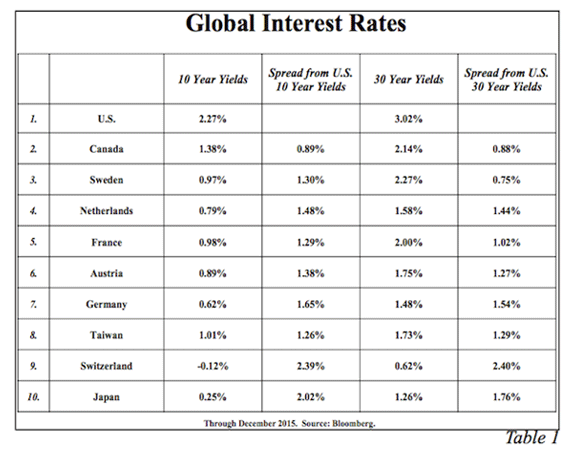
With the trajectory in the nominal growth rate moving down, U.S. Treasury bond yields should work lower, thus reversing the pattern of 2015 and returning to the strong downtrend in place since 1990. In the United States, ten- and thirty-year yields are considerably more attractive than in virtually all of the major industrialized countries (Table 1). At year end 2015, the U.S. thirty-year Treasury bond yield was 154, 176 and 240 basis points higher, respectively, than in Germany, Japan and Switzerland. The U.S. thirty-year Treasury yield was even 88 basis points higher than in Canada. These wide differentials indicate that ample downside still exists for longterm U.S. Treasury bond yields to decline since the attractive U.S. yields should incent global investors to continue to move funds into the United States.
A firm dollar should serve to depress price levels in the United States and restrain the already low pace of domestic inflation. A stabilization of the oil price around current levels could cause the year-over-year increase in the consumer price index (the base effect) to move up from 0.4% currently to around 1.2% this winter, since oil prices will not be as much of an offset to government controlled prices such as medical care, utility bills, taxes or artificially calculated prices captured by home owners’ equivalent rent. This base effect of oil on the CPI, however, will reverse in the late spring and summer and be reinforced by a firm dollar that will have a much more lasting effect on domestic inflation. Moreover, the 34% rise in the dollar from May 2011 has not been fully captured in the imported non-oil prices which have only declined by a mere 3.4%. The pipeline of foreign goods for the U.S. is likely to be filled with lower priced goods for a considerab le time. The minimal adjustment of non-oil import prices relative to the higher dollar indicates that the damage to the trade balance and corporate profits is far from complete. Thus, poor foreign business conditions will continue to be a drag on domestic economic activity while depressing inflation.
The firm dollar will remain a restraining force on economic activity and should cause the year-over-year increase in the CPI to reverse later in the year. Under such circumstances, lower, rather than higher, inflation remains the greater risk. Such conditions are ultimately consistent with an environment conducive to declining long-term U.S. Treasury bond yields. In short, we believe that the long awaited secular low in long-term Treasury bond yields remains ahead.
Hoisington Investment Management Company (www.Hoisingtonmgt.com) is a registered investment advisor specializing in fixed-income portfolios for large institutional clients. Located in Austin, Texas, the firm has over $5 billion under management and is the sub-adviser of the Wasatch-Hoisington US Treasury Fund (WHOSX).