


CONSUMER CONFIDENCE BREAKS OUT
The fundamental backdrop continues to suggest very little chance for a recession in 2017, as just last week Q3 2016 gross domestic product (GDP) was revised up to 3.2% from 2.9%—spurred by strong consumer spending. Additionally, U.S. manufacturing, as measured by the Institute for Supply Management, improved as the U.S. manufacturing index rose to 53.2 in November 2016, thanks to higher construction spending. A reading over 50 suggests economic expansion. This all comes on the heels of the end of the year-long earnings recession, and although we are mid-stage in this economic cycle, fundamentals continue to be on firm footing, if not outright improving.
The other big positive last week (November 28-December 2, 2016) was that the Conference Board’s Consumer Confidence Index in November rose to 107.1, the highest since July 2007. In the late 1990s, consumer confidence was in a steady uptrend, and the index eventually peaked near 145 in early 2000. In other words, not that we are forecasting a return to those lofty levels, but there is plenty of room for this to move higher before there is a major excess of confidence.
As Figure 2 shows, this breakout also coincides with the breakout in the S&P 500. Historically, consumer confidence has confirmed moves in the equity market, and these new highs show no major warnings or divergences. For example, at the October 2007 equity peak, consumer confidence had already broken down, suggesting a major warning under the surface for equities. Fortunately, this isn’t the case currently with both at new highs.
TECHNICALS CONTINUE TO LOOK STRONG, BUT BULLISH SENTIMENT
IS RISING
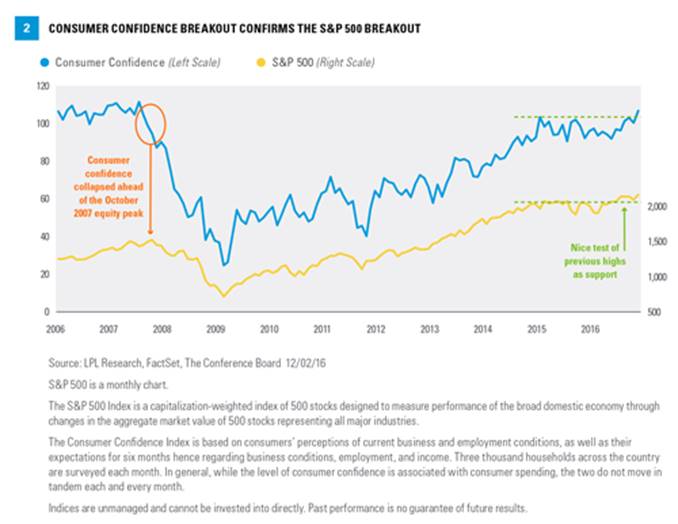
Taking another look at Figure 2, the S&P 500 on a monthly chart clearly found support at the peak in 2015. In technical analysis, finding support at previous resistance levels is important. Should the 2015 peak have been violated, that would have suggested the bull move was in danger. The current technical backdrop looks constructive and the U.S. equities bull market appears to be alive and well.
Sentiment is another important part of technicals. A month ago, the Dow leaked lower for nine consecutive days, the longest daily losing streak in 35 years, although it only lost 1.8%, and many sentiment polls were flashing similar amounts of fear seen right before the Brexit vote in late June 2016. Once the election was over and the worst fears didn’t materialize, the S&P 500 gained 3.4% for the best November in seven years, setting new all-time highs along the way. Now we are seeing a much different sentiment backdrop, as new highs have forced some of the bulls out of hibernation.
The American Association of Individual Investors (AAII) Sentiment Survey had gone a record 54 consecutive weeks without the bulls above 40%. After the election, the bulls finally spiked up to nearly 50%, the highest reading in nearly two years.
Additionally, active managers are now exposed to equities near historic levels. The National Association of Active Managers (NAAIM) Exposure Index came in at 98 last week, one of the highest readings during the 10-year history of the survey, in the top 2% of all the readings. This suggests active managers are nearly fully exposed to equities, which has historically served as a contrarian warning sign.
The big question though is, Are these signs of irrational exuberance? We would rate the overall sentiment backdrop as a near-term concern, but by no means are we seeing the over-the-top type of euphoria seen at major peaks. For instance, the AAII poll had a record of 75% bulls in early 2000, well above current levels. Additionally, according to data from Bloomberg, U.S. domestic equity funds still haven’t seen a weekly inflow since the election. In fact, there have been outflows for 39 consecutive weeks, a clear sign most investors are still wary of things.