


Reformulating Retirement Income Distribution
The historical rate on large-cap stocks (S&P 500) is about 11.5% per year. Since 1926, in only four years has the annual return on S&P stocks been between 11% and 13%. The 20% volatility of such stocks provides a good rationale for this observation. Given the average lengths of business cycles, it is also of interest to note that in recessionary periods, there is a significant probability that a portfolio may lose about 3% per year, every year, over a three-to-five year period.
Now, merge these loss rates with retirement income distribution rates, and to this add the mistiming (sequence risk) of retirement. If our hypothetical retiree were to continue to both withdraw 4% per year and lose 3% per year, then at the end of five years, the compounding effect would cause the fund to lose about 35% of its original value. When the retiree is 70, the possibility that he would live another 25 years on the residual would become very unpalatable.
Typically, well-off (HNW) clients will also live longer due to healthier lifestyles; longevity of retirement life would make matters worse. Of course, what goes without saying, financial planners who didn't know better would most likely have lost one or many such clients under such advisory conditions. (From our buddy system story, it would emerge that the naïve ROT style would come out way superior to most MPT-based allocation systems other than contrived ones.)
Given the recent interest in retirement income distribution issues, academics and financial professionals have developed a plethora of models for this problem. They range from simple rules of thumb (4% per year) to sophisticated mathematical models (e.g., Monte Carlo simulation) to exotic sounding models such as layer cake distribution models. What has been conspicuous has been the absence of distribution models that are completely integrated with business cycles. The rest of this article outlines two schemes that incorporate the business cycle and retirement outlay effects within a fairly sophisticated but easy-to-understand framework for a retirement income distribution model.
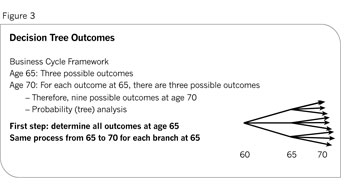
The Decision Tree Model
A reasonable way to consider sequence risk is to represent its effect as unexpected changes in retirement fund values. For the sake of simplicity and using a hypothetical 65-year-old retiree client who begins planning retirement at age 60, we will assume that the funds are invested only between stocks and bonds. There is no loss of information from this exclusion, and the proposed model can be extended to a portfolio containing multiple asset classes in a fairly straightforward manner. However, it is much easier to follow the logic of the proposed model using only two asset classes and, hence, the simplifying assumption.
Let the year of retirement be year zero. In year one, the portfolio value may go up, down or remain generally unchanged. Year two also contains the same possibilities. Additionally, assume that what happens in year one may also have a bearing on what happens in year two, depending on where we are in the business cycle. Thus, year two is likely to witness an increase in portfolio values if year one was the first year of a growth cycle.
In all such examples, it is also important to remember that the opposites in all such examples are equally likely, i.e., if year one was the first recessionary year, then year two would also most likely witness reductions in portfolio value from the continuing market downturn. A third assumption is that the retirement portfolio has some expected rate of return, depending upon the stock-bond mix.
If year one is a good year for equities, the portfolio value should generally outperform the expected outcome. If year two is also a good year, then the portfolio will have accumulated excess returns over a period of two years. Of course, the reverse for contractionary cycles is equiprobable. The above examples of possible changes in portfolio values can be depicted through what is known as a decision tree. Figure 2 below shows such a tree, except that instead of using annual changes it depicts changes on a five-year business cycle periodicity. (See Figure 3.)
Dynamic Portfolio Management
Let us begin by using a numerical example. Let's say that the expected return on the portfolio is 7% per year and the portfolio has produced an average of 8.5% per year over this time period. In this case, a total excess return of 4.5% simple interest has been earned. In such cases, money managers and advanced planners will harvest and extract this excess return and move it forward to the future.