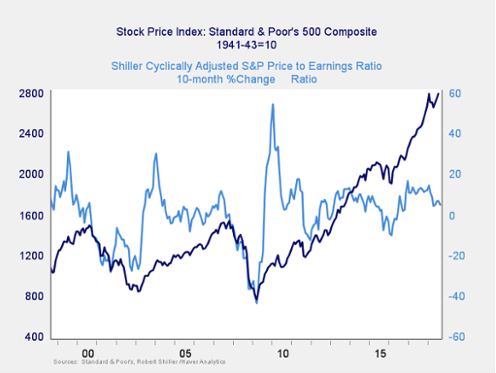
Even as the Shiller P/E ratio is a good risk indicator, however, it is a terrible timing indicator. To get a better sense of immediate risk, we look at the 10-month change in valuations. Looking at changes, rather than absolute levels, gives a sense of the immediate risk level, as turning points often coincide with changes in market trends.
Here, you can see that when valuations roll over, with the change dropping below zero over a 10-month or 200-day period, the market itself typically drops shortly thereafter. In recent months, valuations have dropped toward the risk zone, and they have dropped a bit further in the past month. While the long-term trend in valuations remains at a positive level, risks are rising. Therefore, this indicator stays at a yellow light.
Signal: Yellow light
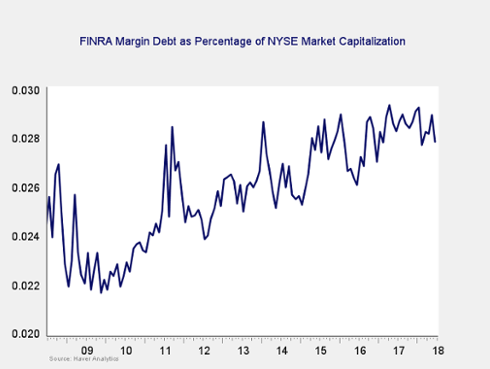
Risk factor #2: Margin debt. Another indicator of potential trouble is margin debt.
Debt levels as a percentage of market capitalization ticked down last month, but they remain close to all-time highs. The overall high levels of debt are concerning; however, as noted above, high risk is not immediate risk.
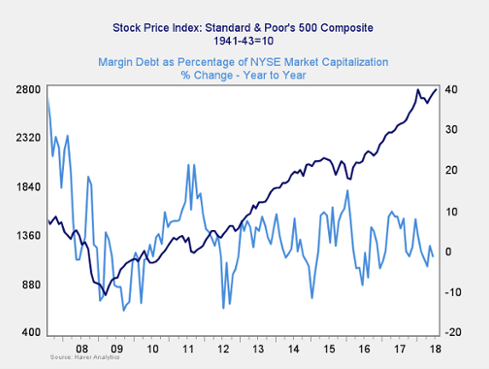
For immediate risk, changes in margin debt over a longer period are a better indicator than the level of that debt. Consistent with this, if we look at the change over time, spikes in debt levels typically precede a drawdown.
As you can see in the chart above, the annual change in debt as a percentage of market capitalization has ticked down in recent months, and it has remained near zero over the past year. So, this indicator is not signaling immediate risk. But the overall debt level remains very high. As such, the risk level is worth watching. We are keeping this indicator at a yellow light.