


Debt levels as a percentage of market capitalization increased notably with the onset of the pandemic, hitting a new high in January 2021. Since then, we’ve largely seen margin debt as a percentage of market capitalization decline. Margin debt increased modestly in June, but it still remains below the recent high that we saw in January. The high level of debt associated with the market is a risk factor on its own but not necessarily an immediate one.
For immediate risk, changes in margin debt over a longer period are a better indicator than the level of that debt. Consistent with this, if we look at the change over time, spikes in debt levels typically precede a drawdown.
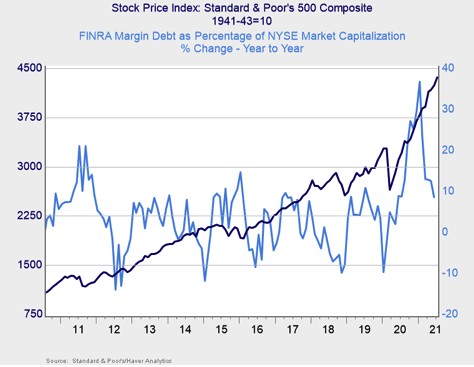
As you can see in the chart above, the year-over-year growth in margin debt as a percentage of market capitalization declined in June to 8.61%. This is the lowest level of year-over-year margin debt growth since May 2020 and is well below the recent high of 36.76% that we saw in January.
Given the fact that margin debt remains below January’s high and that the pace of year-over-year growth continued to slow, we have left this signal at yellow for now. With that being said, the still high level of margin debt on a historical basis is a risk that should be monitored.
Signal: Yellow light
Risk factor #3: Technical factors. A good way to track overall market trends is to review the current level versus recent performance. Two metrics we follow are the 200-day and 400-day moving averages. We start to pay attention when a market breaks through its 200-day average, and a break through the 400-day often signals further trouble ahead.

Technical factors remained supportive for equity markets throughout July. The S&P 500, which managed to break above its 200-day moving average at the end of May 2020, finished above trend every month since. This marks 13 consecutive months with all three major U.S. indices finishing above trend.
The 200-day trend line is an important technical signal that is widely followed by market participants, as prolonged breaks above or below could indicate a longer-term shift in investor sentiment for an index. The 400-day trend line is also a reliable indicator of a change in trend. The continued technical support for markets in July was encouraging, so we have left this signal at a green light.
Signal: Green light