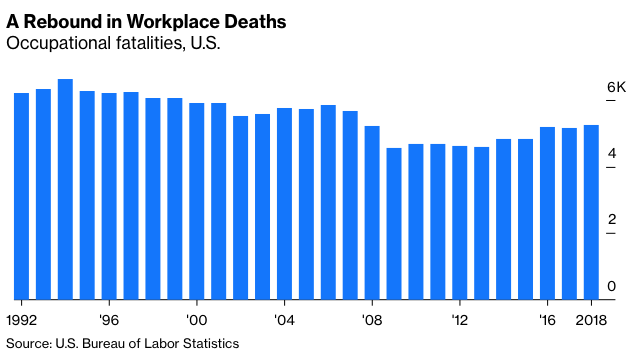
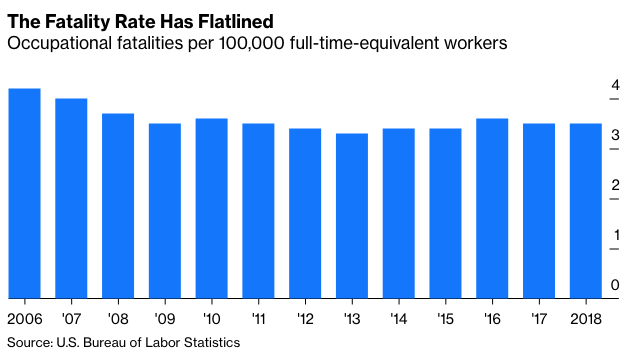
U.S. workplaces have gotten a lot safer over the course of the past century. In 1913, the Bureau of Labor Statistics estimated that there were 23,000 “industrial deaths,” or 61 for every 100,000 workers. In 2018, the number of what are now called “occupational fatalities” was 5,250, according to a BLS survey much more exhaustive than its 1913 precursor, or 3.5 for every 100,000 full-time equivalent workers.
But those 5,250 deaths were an increase over 2017’s 5,147, and workplace fatalities have been up for six of the last nine years (the chart starts in 1992 because that’s when the BLS started its more-complete Census of Fatal Occupational Injuries).

Recessions tend to reduce the number of workplace injuries and deaths, because there are fewer workers to get hurt and because high-risk industries such as construction and trucking are often hit hardest by job losses. Some increase in fatalities was thus to be expected as the economy recovered in recent years, and the current number and rate of fatalities remain below the levels that prevailed before the last recession. (The BLS changed how it calculated the rates in 2006, which is why this chart only goes back that far.)

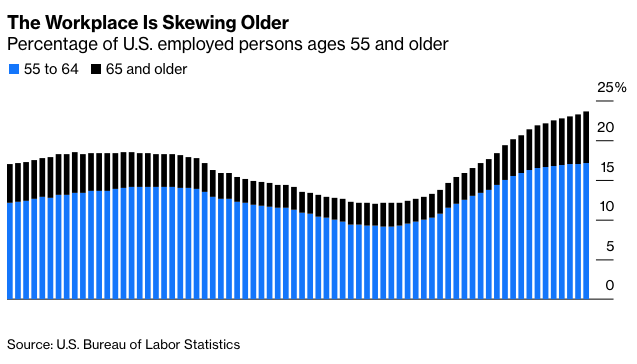
There was, however, something unusual going on in 2006—a housing bubble that pushed the fatality-prone construction sector to its highest share of nonfarm employment since 1956—that makes the drop afterward less impressive and the subsequent failure of the fatality rate to keep falling the bigger story. It is also possible to identify a major force that has been keeping the rate from falling. This force is not necessarily evil, but as a 56-year-old I do find it kind of creepy: More people older than 55 are working, and people over 55 are more likely to die on the job than younger workers.
First, the statistics on 55-plussers in the workplace:

This rise of the older worker is partly just demographics—the giant baby boom generation, as defined by the Census Bureau, ranges in age from 55 to 74. But it’s also because older Americans, especially much-older Americans, are far more likely to be part of the labor force now than they were in the 1970s through 1990s. Among those 65 and older, the labor force participation rate has risen from a low of 10.4% in 1985 to 20.3% now. Among those 75 and older it has gone from 4% to 9.7% percent.
Older Americans are likelier to be working now for a variety of reasons. Some seem entirely positive—despite the recent stall in life expectancy, Americans are living significantly longer than they did a few decades ago, and once-common mandatory-retirement rules have largely disappeared since Congress banned most of them in 1986. A more complicated issue is the changing nature of retirement income: Some Americans work into their 70s because they have no retirement savings, while others have savings but work longer because the defined-contribution plans that now predominate reward delayed retirement in ways that most traditional pensions do not.


