An asset manager's overriding challenge is to consistently preserve and grow the purchasing power of investors' portfolios under a variety of economic conditions. Understanding the breadth of global inflationary or deflationary trends that can occur, and the ways different assets might perform in these environments, is critical to this objective. Based on our research, we have determined that no single asset class can protect investors from inflation. On the contrary, we believe the flexibility and diversification offered by a multi-asset-class strategy is necessary to help weather and exploit changing, and potentially very different, inflation regimes.
The Loomis Sayles Multi-Asset Real Return strategy seeks to take advantage of the firm's best fixed income, equity, currency and commodity ideas in an attempt to protect and grow capital in real-inflation-protected-terms.
The investment team differentiates potential relative values among asset classes and allocates across them, attempting to tactically exploit investment opportunities produced by various types of price pressures while minimizing the risk they can present. The ability to go long and short and use derivatives adds to the investment team's alternatives as they attempt to capitalize on inflation in its many forms across economies worldwide.
The following definitions and historical vignettes give a view to a myriad of inflationary and deflationary trends that can produce investment opportunities for the Multi-Asset Real Return strategy.
CLASSIC INFLATION
Classic inflation is the most common form of inflation in developed countries. It typically occurs when an economy is "overheating," whereby demand is growing faster than supply. Prices rise as growth pushes the economy toward its capacity constraints. Central banks respond to higher growth and inflation by raising interest rates. In an ideal world, central banks would be able to manage economic growth and inflation so that growth is consistently maximized and inflation is low and steady, but inevitably there are situations that make attaining these goals difficult if not impossible. They are typically political in nature.
Example: India (2005-Present)
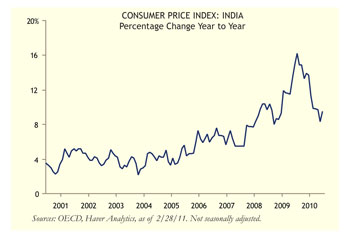
The Indian economy is currently in a classic inflation cycle due to various bottlenecks in the economy that are difficult for policymakers to resolve. The agricultural sector is a case in point. The past two years have seen marked increases in government spending geared toward rural development, which has in turn boosted income growth in rural areas. The national average-per-capita income is quite low, about $1,200 in US dollars1, which results in nearly 50% of household consumption being devoted to spending on food, beverages and tobacco. World Bank estimates suggest that incremental demand for grains at this income level is also about 50%. The failure to increase the food supply to match rising demand has resulted in upward pressure on local food prices. Monetary policy is becoming tight by some measures, but the policy rate has been below the rate of inflation for more than two years. Government budgets have also been persistently loose. Meaningful fiscal tightening may be required to slow domestic demand, but this step is challenging given the country's extensive poverty. Unless policy becomes significantly tighter, there is a risk that India will see inflation expectations rise and inflation become a continual problem.
CONTAINED INFLATION
Contained inflation is a state of classic inflation in which central banks successfully manage steady economic growth and low inflation. When a country first gains control of inflation, it typically aims for a continually lower rate over time. In practice, policy makers generally attempt to hold inflation steady during economic expansions and wait for recessions and supply shocks to push the inflation rate lower. Eventually a state may be reached where an inflation target remains constant over time.
Example: The Great Moderation (1987-2009)
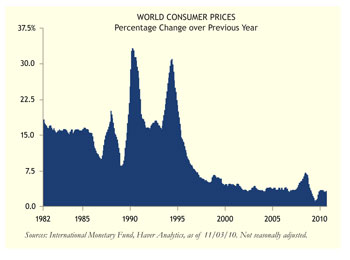
During the Great Moderation, many countries were able to contain inflation successfully. While better monetary policy is often given the primary credit for lower inflation, other factors likely contributed. Commodity price inflation was in a secular disinflationary trend throughout the 1980s and 1990s. Globalization was also a dynamic force in reducing price pressures. The growing labor force in China, lower trade barriers, deregulation and innovation all helped to reduce the prices of many goods and services produced abroad while competitively reducing domestic price pressures around the world. According to International Monetary Fund (IMF) figures, world inflation fell from above 15% in 1995 to below 4% between 2002 and 2007.
DEFLATION
Deflation is an outright decline in prices due to shrinking of the money supply and aggregate demand. As the value of money increases, deflation stunts growth as businesses become reluctant to invest in new production that they expect to be able to build more cheaply in the future. Consumers delay purchases of goods for the same reason. Historical experience suggests that some of the most persistent cases of deflation were preceded by banking and currency crises, correlated with sustained declines in asset prices and aggravated by debt deflation.
Example: Hong Kong (1998-2004)
After the 1982 announcement that China would eventually reclaim Hong Kong, currency instability ensued. By the end of 1983, Hong Kong began to peg its dollar to the US dollar in order to maintain confidence in its currency. At the same time, monetary policy began operating under a linked rate system, where Hong Kong interest rates followed US interest rates.
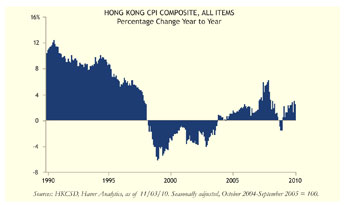
During the 1997 Asian financial crisis, capital fled many Asian countries and currency values declined dramatically. However, the Hong Kong dollar remained stable. In part, this was due to the resiliency of Hong Kong's financial system. Like other Asian countries, Hong Kong had a real estate bubble that popped in 1997; but low leverage in the banking system, caused by lending rules that required high equity funding for borrowers, allowed the banks to avoid financial collapse. The resulting relative strength of the Hong Kong dollar versus neighboring countries' currencies made its exports that much more expensive. As a small economy with no controls on the movement of capital, but inflexible exchange and interest rates, competitive adjustments occurred solely through deflation of consumer prices, property prices, rents and wages over the following six years.
"STAGFLATION"
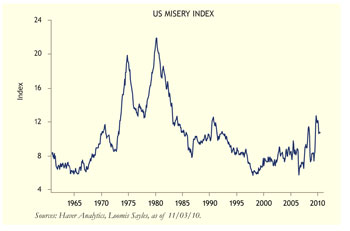
"Stagflation" is a term first coined by UK finance minister Iain Macleod to describe the country's high inflation and unemployment in 1965. Monetary policy decisions are extremely difficult in these situations since they cannot address both issues simultaneously. Economist Arthur Okun2 created the Misery Index (calculated as the unemployment rate plus the inflation rate) in the 1970s as a way to measure the extent of the problem.
Example: US (1970s)
Stagflation was a global phenomenon throughout the late 1960s and early 1970s. It was a result of many economic forces occurring simultaneously. In the US, inflation began as a classic inflation cycle during the late 1960s as a result of Lyndon Johnson's simultaneous federal spending on his Great Society programs and the Vietnam War. This excessive government spending eventually led to Richard Nixon's wage and price controls of 1970 and the dissolution of the Bretton Woods currency agreement, which preceded a 30% devaluation of the dollar over the following 10 years. Major oil-price shocks in 1973 and 1979, continually rising inflation expectations and a monetary policy that was too loose exacerbated conditions.
HYPERINFLATION
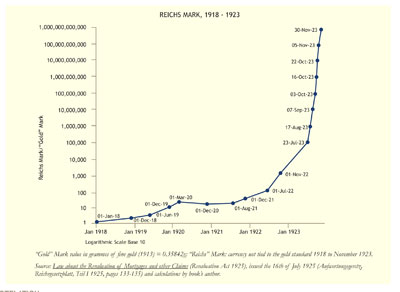
Hyperinflation is often defined by economists in different ways, but a good rule of thumb is a doubling of prices in less than three years. Hyperinflation has most often been linked with periods of extreme economic and social dislocations. The US came close to hyperinflation during the Revolutionary War, reaching an inflation rate of 47% in November 1779, and during the Civil War, peaking at 40% in March 1864. From January 1861 to October 1864, the US Confederate money supply increased by a factor of 11.5.
Example: Weimar Republic (1921-1923)
Runaway inflation often occurs following a war and is associated with a complete breakdown in the political and economic environment. The Weimar Republic in Germany following World War I is one of the more famous examples. By 1923, the Republic decided it could no longer afford the reparation payments mandated by the 1919 Treaty of Versailles. As a result, French and Belgian troops took over many of the Republic's important industries, and workers went on strike but continued to receive wages from the government.
As the economy essentially shut down, the government had to print money to continue to operate. Inflation surged and eventually reached hyperinflation. By December 1923, Germany had returned to the gold standard and its exchange rate was 4.2 trillion Reichs marks to one US dollar. Economists do not have a solid understanding of what causes inflation to evolve into hyperinflation, but historically there seems to have been "tipping points" that, when breached, have caused inflation to accelerate exponentially.
DEBTFLATION
Debtflation can result from excessive debt levels and often precedes currency devaluation, defaults and inflation. The extensive research of noted economists Carmen Reinhart and Kenneth Rogoff3 illustrates that these relationships have held for hundreds of years. The process of debtflation has similar roots to that of hyperinflation. It begins with unsustainably high public or private borrowing followed by currency declines, rising inflation and rising money growth. As interest rates rise, the government budget becomes overwhelmed by interest payments. Like hyperinflation, the process can end only when the government finds a way to regain control over its finances and credibly maintain a balanced budget.
Example: Iceland (2008-2010)
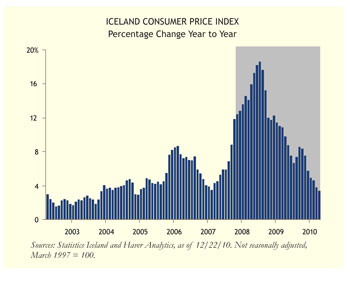
By 2007, Iceland's three big banks had outstanding loans totaling nine times the country's GDP, up from two times GDP in 2003. During the financial crisis of 2008, all three banks faced a run on deposits and an inability to refinance short-term debt obligations.
Within two years of the banks' collapse, Iceland's currency had fallen by 50%, its stock market had collapsed, interest rates had surged as the central bank tried to stabilize the exchange rate and inflation had risen to more than 18% at its peak. The market reaction to the financial crisis had been swift as investors quickly recognized that the country's solvency was in jeopardy. The exact toll on Iceland's debt obligations is still unknown, but the IMF called Iceland's banking failure the largest in history relative to the size of a country's GDP.
An Evolving Opportpportunity Set for the Loomis Saylesayles Multilti-Asset Real Return Strategytrategy
We offer these "flation" vignettes to demonstrate the diverse price pressures that can affect economies and influence purchasing power over time. Each type of inflation, with its own set of drivers, represents opportunities and risks that have varying implications for investment performance.
Loomis Sayles Multi-Asset Real Return is a strategy that seeks out and attempts to capitalize on the opportunities afforded by any type of price trend across a broad set of countries. For example, we believe the current inflationary surge in many emerging markets has its roots in monetary policy being too easy for too long in an economic rebound, paired with rapid increases in agriculture and food prices. For portfolio managers to protect and build purchasing power amid this trend entails assessing each country's fundamentals individually, including: current fiscal stance, monetary policy reaction function, willingness to use currency appreciation as a policy tool and surplus or deficit of agricultural goods.
This type of analytical work underpins our investment selection across local bond and equity markets and our currency and commodity preferences. We believe careful research and a deep focus on the causes of global price trends can expand the investment opportunity set for this strategy and increase any potential for preserving and growing investor capital.
Kevin Kearns is Portfolio Manager and Senior Derivatives Strategist at Loomis, Sayles & Company


