


You will also notice in the chart that much of that change happened in 2008. Why was that? That’s when the Fed took interest rates down to nearly zero, meaning it suddenly took more cash to fund future payments. Also, some strapped localities conserved cash by promising public workers more generous pension benefits in lieu of pay raises.
According to a 2014 Pew study, only 15 states follow policies that have funded at least 100% of their pension needs. And that estimate is based on the aggressive assumptions of pension funds that they will get their predicted rate of returns (the “discount rate”).
Kentucky, for instance, has unfunded pension liabilities of $40 billion or more. This month the state budget director notified local governments that pension costs could jump 50-60% next year. That’s due to a proposed reduction in the system’s assumed rate of return from 7.5% to 6.25% – a step in the right direction but not nearly enough.
Think about this as an investor. Do you know a way to guarantee yourself even 6.25% average annual returns for the next 10–20 years? Of you don’t. Yes, some strategies have a good shot at doing it, but there’s no guarantee.
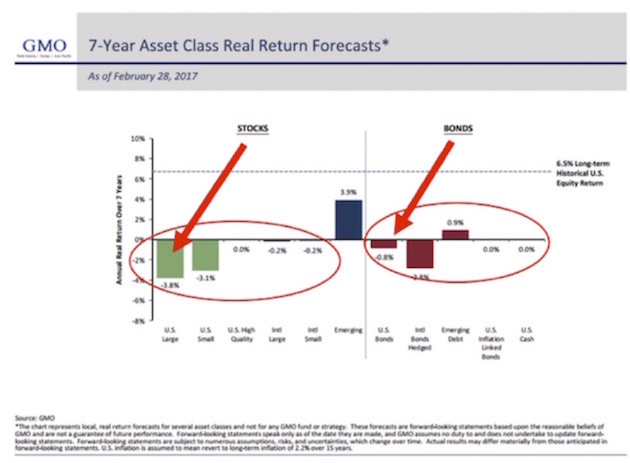
And if you believe Jeremy Grantham’s seven-year forecasts (I do: His 2009 growth forecast was spot on), then those pension funds have very little hope of getting their average 7% predicted rate of return, at least for the next seven years.
Now, here is the truth about pension liabilities. Let’s assume you have $1 billion in funding today. If you assume a 7% compound return – about the average for most pension funds – then that means in 30 years that $1 million will have grown to $8 billion (approximately). Now, what if it’s a 4% return? Using the Rule of 72, the $1 billion grows to around $3.5 billion, or less than half the future assets in 30 years if you assume 7%.
Remember that every dollar that is not funded today means that somewhere between four dollars and eight dollars will not be there in 30 years when somebody who is on a pension is expecting to get it. Worse, without proper funding, as the fund starts going negative, the funding ratio actually gets worse, sending it into a death spiral. The only way to bring it out of the spiral is with huge cuts to other needed services or with massive tax cuts to pension benefits.
The State of Kentucky’s unusually frank report regarding the state’s public pension liability sums up that state’s plight in one chart:
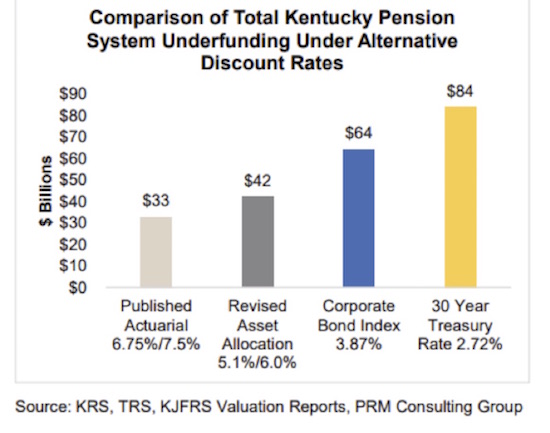
The news for Kentucky retirees is quite dire, especially considering what returns on investments are realistically likely to be. But there’s a make or break point somewhere. What if pension plans must either hit that 6% average annual return for 2018–2028 or declare bankruptcy and lose it all?
That’s a much greater problem, and it’s a rough equivalent of what state pension trustees have to do. Failing to generate the target returns doesn’t reduce the liability. It just means taxpayers must make up the difference.
But wait, it gets worse. The graph we showed earlier stated that unfunded pension liabilities for state and local governments was $2 trillion. But that assumes an average 7% compound return. What if we assume 4% compound returns? Now the admitted unfunded pension liability is $4 trillion. But what if we have a recession and the stock market goes down by the past average of more than 40%? Now you have an unfunded liability in the range of $7–8 trillion.
We throw the words a trillion dollars around, not realizing how much that actually is. Combined state and local revenues for the US total around $2.6 trillion. Following the next recession (whenever that is), the unfunded pension liabilities for state and local governments will be roughly three times the revenue they are collecting today, and that’s before a recession reduces their revenues. Can you see the taxpayer stuck between a rock and a hard place? Two immovable objects meeting? The math just doesn’t work.