


Why would we write a report about recession with the S&P 500 at record highs? Consider it a check-up. Just because you feel good doesn’t mean you skip your annual physical at the doctor. We check in on some of our favorite leading indicators to see if any cracks are forming in the economic expansion and its accompanying bull market.
No Sign Of Immediate Recession Or Bear Market
With stocks setting more new record highs last week, why are we concerned about watching for recession? While our outlook is still optimistic, we don’t want to be complacent. We expect steady growth in the U.S. economy and corporate profits in 2020. We are encouraged by recent progress on trade and evidence of stabilizing growth in international economies, and we expect further gains for stocks are possible.
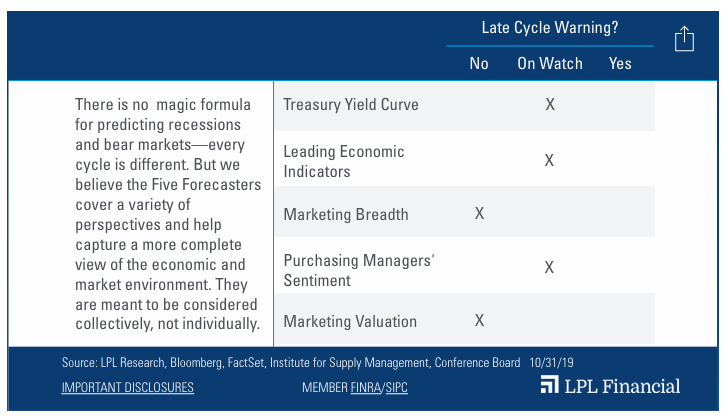
However, as shown in our Five Forecasters chart [Figure 1], some indicators suggest the bull market might be running out of steam, while others suggest we may have quite a bit more room to run. Overall, we see near-term recession risk as low, but we’ll continue to monitor data for any late-cycle or recessionary signals.
Leading Economic Index
While coincident economic data helps capture current economic health, leading indicators can help better forecast the near-term economic trajectory. The Conference Board’s Leading Economic Index (LEI) is calculated from 10 individual leading data sets, including weekly jobless claims, manufacturers’ new orders, building permits, and stock prices. The LEI is one of our favorite economic indicators because of its predictive power: The Index has turned negative year over year an average of 14 months before every recession since the 1970s.
The LEI rose 0.4% year over year in September, its 118th straight increase. We believe the LEI is signaling continued economic growth, but we’re monitoring the index more closely given that September’s reading was its slowest pace of year-over-year growth since June 2016. The index has largely remained flat this year, suggesting that the smaller annual gains reflected 2018 strength, not renewed weakness. We expect this indicator to benefit from easier year-over-year comparisons in the coming months, with possible support from additional progress on trade agreements, stock market gains, and the yield curve.
Yield Curve
Yield curve inversion has preceded each of the nine recessions going back to 1955, so it’s understandable that this signal has spooked some investors this year. In March, the 10-year U.S. Treasury yield closed below the 3-month yield for the first time since 2007. The spread between the 2-year and 10-year yield followed suit in August.