Reporters often prepare obituaries in advance for ailing celebrities so that when the end comes, they can publish instantaneously. Occasionally, someone hits “publish” prematurely, posting tributes for public figures who are very much alive.
In the same way, much ink has been hastily spilled recently in obituaries for active management. Most of the negativity has focused on the rise of passive investing, which has enjoyed strong performance during the past few years. But simply because one style of investing has come into favor does not mean others are going the way of the dodo.
So why are so many pundits ready to write off active management? And what makes us so sure that investing actively is not only a viable but essential part of investor portfolios?
Key Points
- The performance of active and passive management has been cyclical, with each style trading periods of outperformance.
- Market corrections are a regular and unavoidable part of market cycles.
- Active management has typically outperformed passive management during market corrections, because active managers have captured alpha1 as the market recovers.
What Have You Done For Me Lately?
Recency bias is the tendency to believe that recently observed patterns will continue into the future, and it’s a powerful force that can influence investor decisions. But investors who only take recent performance into account are missing the forest for the trees. After all, yesterday’s events shouldn’t determine how tomorrow’s investment decisions are made.
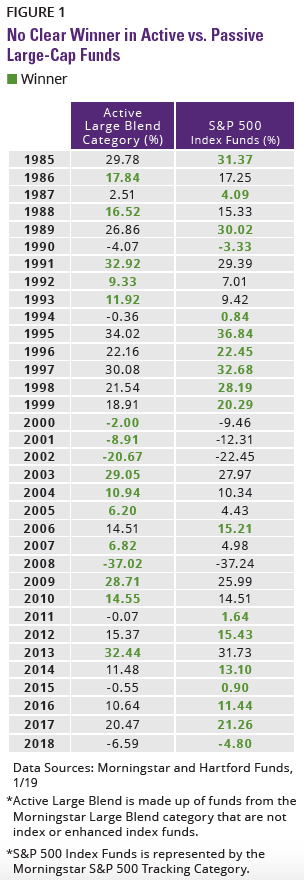
Morningstar Large Blend is the largest Morningstar category, with $2.80 trillion in net asset size, constituting 17% of the US mutual fund market.2 We selected this category because it is widely believed to be the most efficient—the one in which active investing supposedly makes the least sense. To represent active, we removed all index funds and enhanced index funds. For passive, we used the Morningstar S&P 500 Tracking category. As shown in FIGURE 1, passive large-blend strategies have outperformed active large-blend strategies for the last five years, which helps to explain why in 2018 passive US equity funds had inflows of $271 billion, while more than $175 billion under active management headed for the exits.3
But the past five years only tell part of the story. A wider look at the chart reveals active and passive have traded the lead in performance over time like two evenly matched racehorses. From 2000 to 2009, active outperformed passive nine out of 10 times. During the decade before that, passive outperformed active seven out of 10 times. And over the course of the past 34 years, active outperformed 16 times, while passive outperformed 18 times.
We’ve seen that the cyclical nature of active vs. passive investing definitely applies to the Morningstar Large Blend Category. The same holds true for other investment categories such as mid-caps, small-caps, and global/international equities. And just like performance, investor sentiment moves in cycles. If a certain style or asset class is doing well, investors are quick to extol its virtues and pour their money into it. It’s no surprise, then, that passive investing is the new darling of many investors and much of the financial press. But just as a marathon isn’t decided by the final 100 yards alone, we believe the dismissal of active management based on recent performance alone could be imprudent.
"From 2000 to 2009, active outperformed passive nine out of 10 times."
All investments are subject to risks, including the possible loss of principal. Performance data quoted represents past performance and does not guarantee future results.
Active or Passive? Yes.
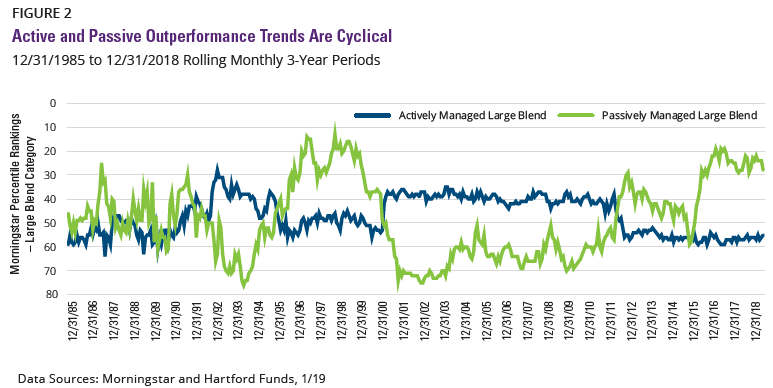
Like the ocean tides, active and passive management’s performance ebbs and flows. And as FIGURE 2 demonstrates, their performance cycles are clearly defined. The chart compares the rolling monthly 3-year performance percentile rankings for active managers with that of passive managers ranked within the Morningstar Large Blend category.
FIGURE 2 shows that while overall there is no clear winner over the past 30 years, there has been a clear winner in active vs. passive performance for multiple and sustained periods, followed by a trading of positions. Once again the recent outperformance of passive is evident, and is preceded by 10 years of dominance by active management, and so on.
The story that FIGURES 1 and 2 tell is clear. Just when it seems that active or passive has permanently pulled ahead, markets change, performance trends reverse, and the futility inherent in declaring a “winner” in active vs. passive is revealed anew.
Home Runs: Part of the Cycle
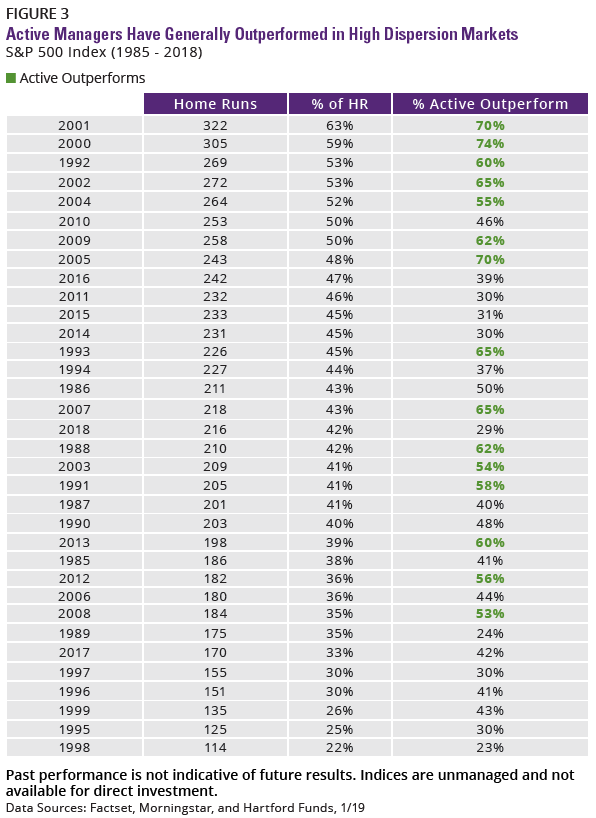
Active/passive cyclicality is further demonstrated with high and low amounts of stock “home runs”—that is, a stock that outperforms the benchmark by 25% or more. Markets that feature large amounts of home runs signal dispersion in stock returns. High dispersion should benefit active managers who can single out the winners, whereas a low number of home runs indicates stocks are moving together, which typically benefits passive management.
In FIGURE 3, we’ve ranked the past 34 years from highest to lowest in terms of which stocks within the S&P 500 Index had the most home runs. The average number of home runs during this time period was 212. Sure enough, in years that feature a high number of home runs, active tended to outperform. And when there were fewer standouts, passive was the clear winner. It’s just another example of how the performance of active and passive management has remained faithful to cyclical trends.