


After a strong resurgence from last year’s bear market, the S&P 500 Index looks stretched. By at least one valuation measure, the leading gauge of the U.S. stock market has rarely been more expensive during the past three decades.
On the other hand, the S&P 500 may not be the best measure of the market because it is increasingly dominated by a handful of behemoth technology companies. The so-called Magnificent Seven—the biggest seven stocks in the S&P 500 by market value—have led the rally this year and are now among the most expensive stocks in the index.
All of which raises the question: Are U.S. stocks expensive, or does it only seem that way because a few companies are pulling up the S&P 500’s valuation?
Despite numerous warnings of an epic stock market bubble and imminent collapse in recent years, which seemed prescient when stocks sold off last year, the market never became cheap. At the end of 2022, the S&P 500 traded at a forward price-earnings ratio of 23 based on expected earnings for the fiscal year, modestly higher than the average forward P/E ratio back to 1990, when the data series begins. Now the S&P 500 is meaningfully more expensive, trading at closer to 28 times earnings, a mark exceeded only during the dot-com era in the late 1990s and again earlier this decade.
Not all stocks in the S&P 500 are equally represented, though. The index’s components are weighted by their market value, which favors the biggest companies. The Magnificent Seven—Apple Inc., Microsoft Corp., Alphabet Inc., Amazon.com Inc., Nvidia Corp., Tesla Inc. and Meta Platforms Inc—have swelled relative to the field in recent years. They now account for nearly 30% of the index.
They have also been among the big winners this year. Nvidia and Meta are the best-performing stocks in the S&P 500 this year. Tesla ranks fifth, and the remaining four are squarely in the top decile. The Magnificent Seven have rarely been cheap, but this year’s rally has pushed them to rarefied levels. They boast an average P/E ratio of 43, almost double the average ratio of 25 for the rest of the field.
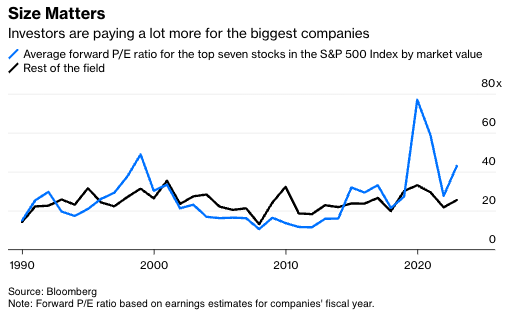
That spread between the average P/E ratio for the seven biggest companies in the S&P 500 and that of the rest of the field has rarely been this wide. For starters, the biggest companies are not always the most expensive—the average P/E ratio of the top seven has been higher than that of the field roughly half the time since 1990, counted annually. As for the other half, the valuation spread between the top seven and the field surged to a record in 2020 and has since receded, although it remains comparable to the dot-com peak in 1999.
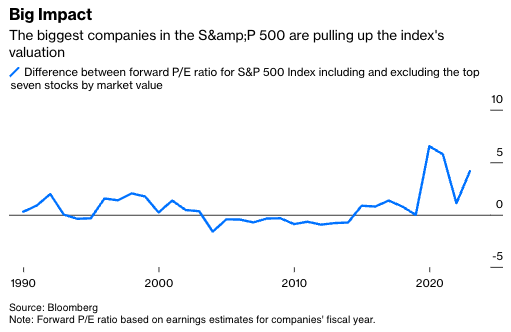
It stands to reason, then, that the market is cheaper when the Magnificent Seven are excluded, and it is, although not as cheap as you might think. For like comparison, I calculated a weighted average P/E ratio for the S&P 500 including and excluding the biggest seven stocks by market value for every year back to 1990. The numbers confirm that when the Magnificent Seven are excluded, the index’s current P/E ratio falls to 24 from 28.
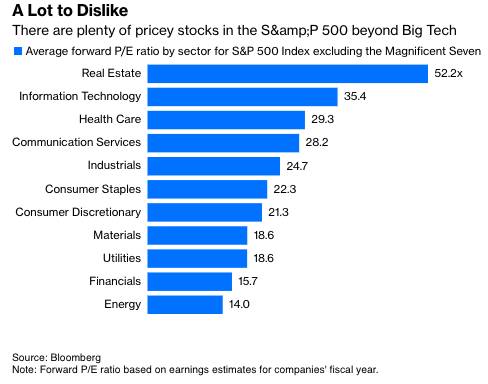
But 24 times earnings is no bargain, either. It’s higher than the average P/E ratio of 21 for the S&P 500 excluding the top seven back to 1990. It’s also among the highest P/E ratios on record for that group, rarely exceeded before 2019 and mostly during the dot-com era. Even without the Magnificent Seven, the technology sector trades at an average P/E ratio of 35, and seven of the 11 S&P 500 sectors boast an average P/E ratio greater than 20. Any way you slice it, U.S. stocks are far from cheap.
Perhaps more important to some investors, the yield on three-month Treasury bills now exceeds the earnings yield—the inverse of the P/E ratio—for the S&P 500 minus the top seven by close to 1.2 percentage points. It’s the first time the yield on T-bills exceeded the group’s earnings yield since 2000 and the third-highest spread favoring T-bills on record.
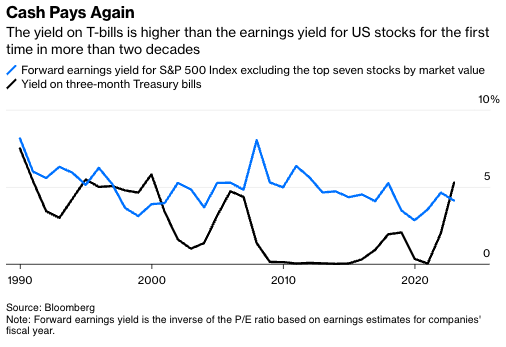
That doesn’t mean T-bills will outperform stocks; over the long term, they almost certainly will not. But some investors will prefer to hold cash until short-term interest rates or stock valuations decline, which may help explain the big flows to money market funds this year. And if enough investors choose cash, watch out for falling stock valuations.
So, yes, the biggest companies are expensive, and they’re pulling up the valuation of broad market gauges like the S&P 500. But the rest of the field is plenty pricey, and there’s no way to pin that on the Magnificent Seven.
Nir Kaissar is a Bloomberg Opinion columnist covering markets. He is the founder of Unison Advisors, an asset management firm.