


Dueling Narratives
One of the oldest standbys of the market reporter is the “psychologically important” landmark. It comes up frequently in market commentary, usually without explaining who finds it psychologically important, or why. It does, however, at least allow a lazy way to explain the frequent importance of intangible narratives, or of mental shortcuts, in market moves. Beyond that, it is often psychologically important to reporters to have at least some kind of an explanation for a strange move in the markets.
I bring this up because the S&P 500, the most important stock market index in the world in both psychological and many other terms, managed to breach three separate psychologically important landmarks in early trading Tuesday. It got back through the round number of 3,000; it managed to get above its 200-day moving average for the first time in the Covid crisis, suggesting it had returned to an upward trend; and it moved decisively above its 61.8% Fibonacci retracement level, having tracked it for several days. Here is the chart I tweeted early in the trading day:
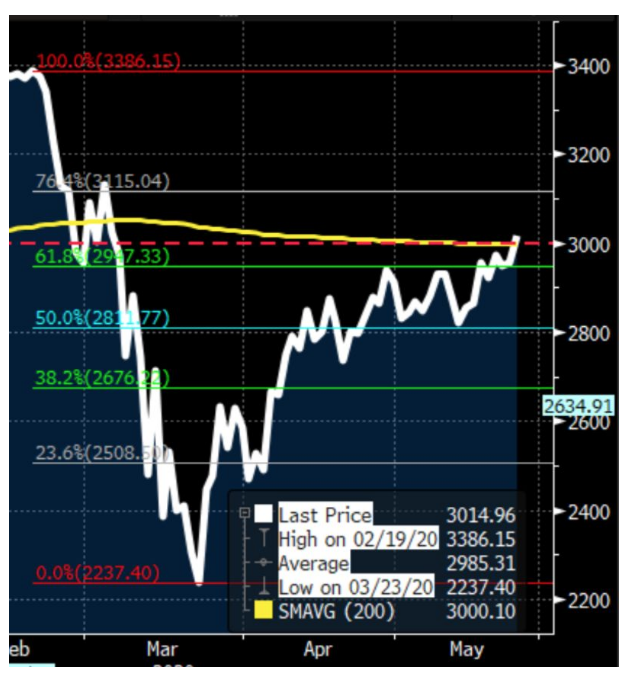
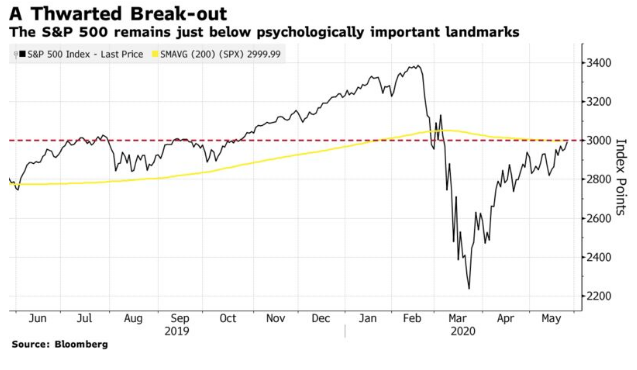
Unfortunately, these barriers weren’t as psychologically important as thought. Either that, or they were so psychologically important to many traders that they felt unworthy to take the index there. The market tumbled sharply in the last hour of trading, leaving the S&P slightly below 3,000, which at this point is almost identical to the 200-day moving average:
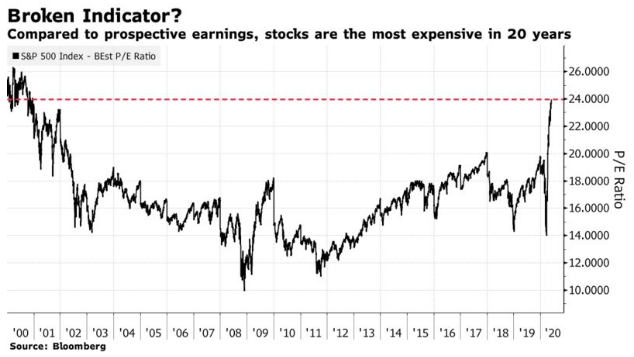
What happened? Before we get into technical analysis, or looking at the charts, it is worth making clear that when valuations move a certain distance beyond rationality (when you would think they would be causing intense psychological pain to everyone trading the market) they cease to be useful for gauging the near-term future. This is particularly so when there has been a major external shock, as is the case at the moment. Judged as a multiple of this year’s earnings (as measured by the estimates collected by Bloomberg), the S&P 500 was already as expensive as it had been at any time since 2000. The P/E ratio briefly topped 24 in the early going. But few have a clue where earnings are heading, and in any case an expensive market can always get more expensive. So extreme valuations should tell long-term investors to beware, but don’t tell a trader to bail out instantly:
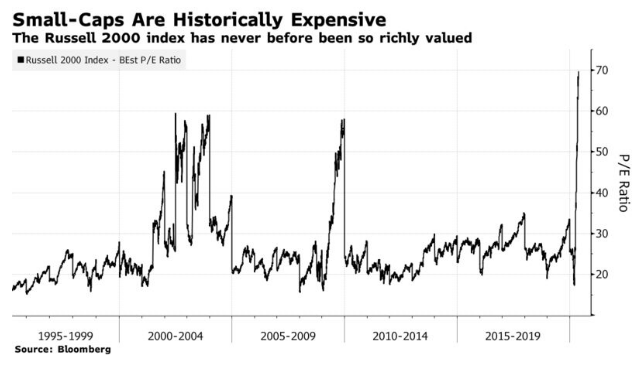
Incidentally, the large-cap stocks of the S&P 500 have been outperforming smaller companies for a while, but the overvaluation of the Russell 2000, the main U.S. index of small-caps, is even more extreme. On the same basis, the Russell is now valued at almost 70 times this year’s earnings, and is even more expensive than it was during the TMT bubble. This is nuts, unless a lot of traders are convinced that the brokers publishing forecasts don’t know what they are doing:
So with reference to their own history and fundamentals, U.S. stocks were hugely overvalued to start the day, and valuation provided no new reason to sell late in the day. To bulls who point to historically low bond yields, which weren’t around 20 years ago when stocks were last this expensive, we can add that the economy hadn’t just sustained a historic hit and unemployment wasn’t at record levels in 2000, either.