Over the last 10 years or so, there has been intense speculation about the size, scale and scope of the boomer retirement market. Speculate no more.
Beginning in 2010, the first group of boomers reached retirement age. It is now time to properly characterize this generation of Americans born between 1945 and 1964 so that advisors can truly appreciate the colossal nature of the task at hand.
In 2010, baby boomers could be divided into two age groups: those between 55 and 64 and those age 45 to 54. For distinction, we'll classify the first group, born between 1945 and 1954, as "old boomers" and the latter as "young boomers."
The Size Of The Current Pre-Retiree Market
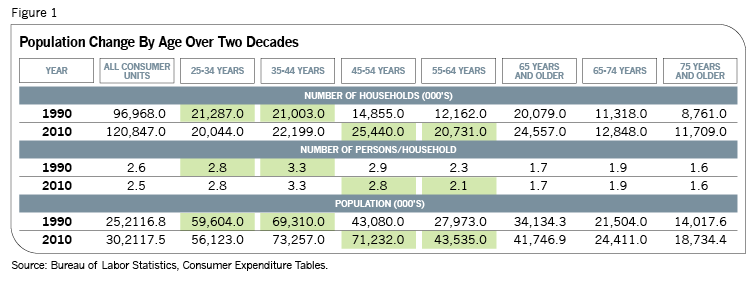
Let's start with the composition and size of the age bands over time. Figure 1 illustrates the makeup and size of the boomer market, highlighted in light green.
There are some immediate and striking observations. Between 1985 and 2010, all age groups increased in size as the U.S. population went from 238 million to 302 million. Oddly, the only group to defy this trend has been the 65-74 group, which has remained about the same size. Also striking is the change in household sizes. Today's boomers have significantly fewer dependents living at home than the pre-retirees of 25 years ago. However, since the 2008 financial crisis, this trend has slightly reversed, probably reflecting the large number of young unemployed who have moved back in with their parents to save rent money.
In 2010, there were about 42 million Americans aged 65 and older. As boomers retire, this market will swell to about 110 million by 2030, nearly tripling in size. Furthermore, the current pre-retirement market is about 65% bigger than what it was 20 years ago. Unfortunately, this group is woefully underprepared for retirement, more than any group before them if we compare their retirement savings to their current expenditures.
The Boomer Doomer
For retirement savings data, we turn to Employee Benefits Research Institute (EBRI) reports. For 2010, EBRI data shows that people over 60 employed for 30 or more years had about $200,000 in their 401(k) accounts, while people in their 50s are poised to retire with similar account balances. Even if we didn't take living costs into account, it is obvious that these amounts are inadequate, even for two-income families. Moreover, the time required to undo such gross errors is running out.
To understand how we got here, we must look into the lifestyles of boomers and the amounts they are spending today to finance their lifestyles. Figure 2, again using BLS data, shows the income of boomers and how it is accounted for using standard GDP guidelines.
In 1990, young boomers were earning about $31,000, consuming nearly 80% of that, saving 10% (including retirement contributions) and paying another 10% in taxes. By 2010, these same young boomers demonstrated nearly the same consumption pattern as before, while their personal savings were up at 15%, and personal taxes were down to only 5% of their total income. It is interesting to see that this group of young boomers maintained their living standards (consumption-to-income ratios) throughout the years. Even the 2008 crisis did not change their basic saving/spending behavior.


