


Given that the Barclays Intermediate Government Bond Index began in January 1973, we decided to test three time frames. First, we assumed a retirement that began on December 31, 1972, and lasted for the entire 42 years of available data. Next, we tested a retirement that began right before the 1987 bear market, assuming the retirement began on August 31, 1987, and has run for more than 26 years. Finally, we looked at the impact of the tech bubble and subsequent meltdown with a retirement that began in December 1999 and has run 14 years.
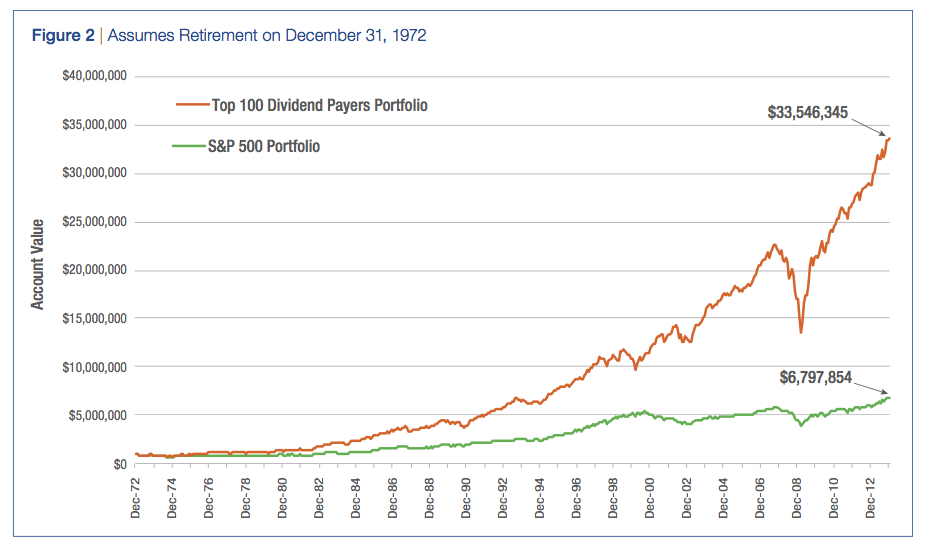
Scenario 1: December 31, 1972, to December 31, 2013
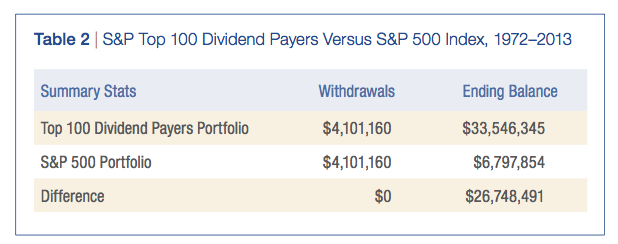
Figure 2 illustrates the ending account value for each year, assuming the retirement began on December 31, 1972. The Top 100 Dividend Payers portfolio far exceeded the performance of the S&P 500 portfolio. The withdrawal amounts under both scenarios are identical, but the corpus of the dividend-focused portfolio grew $26.7 million more than the S&P 500 Index portfolio. Table 2 shows the details.
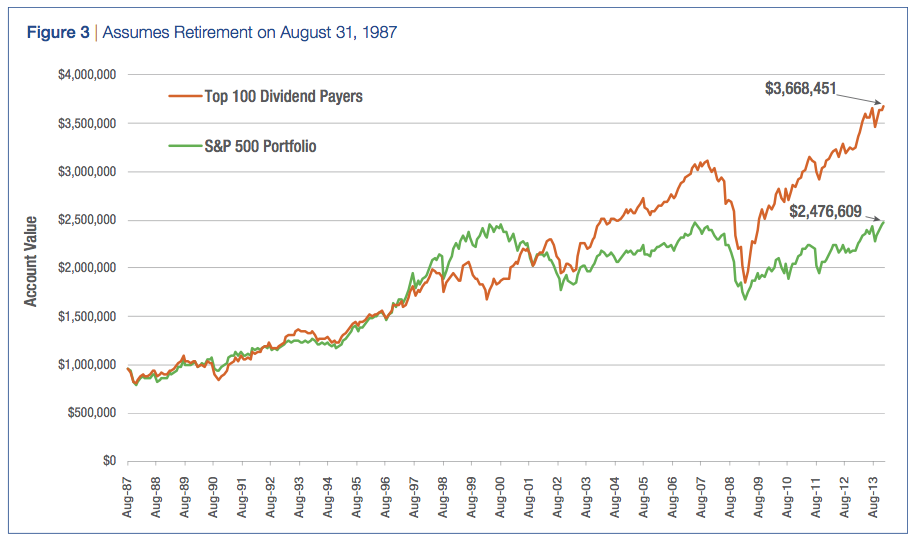
Scenario 2: August 31, 1987, to December 31, 2013
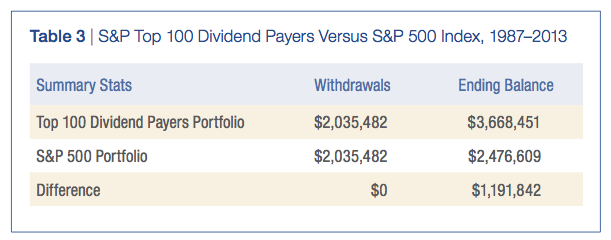
For the retirement that began just before the 1987 bear market, the dividend-focused stock portfolio again outperformed the S&P 500 Index portfolio (Figure 3). Note that the dividend-focused strategy lagged during the technology bubble from mid-1990 to 2001 but outperformed before and after that period. As shown in Table 3, the withdrawals were identical while the corpus for the dividend-focused portfolio exceeded the S&P 500 Index portfolio by $1,191,842.
The Case For A High And Growing Dividend Stock Strategy In Retirement Portfolios
October 15, 2014
« Previous Article
| Next Article »
Login in order to post a comment
Comments
-
Many of us veterans in the investment and planning worlds internalized your findings many years ago, and have all but rejected the income products to which you refer. The challenge is convincing nervous and I dare say, ignorant (not stupid, just ignorant of how the world's economy works) investors who have been approached by the product purveyors. More than anything else, if we have become teachers.