


Last year, money in passive funds surpassed the assets in active funds. Many financial advisors might view this as confirming what they have long recognized—there’s a place for passive strategies alongside active investing.
Passive Overtakes Active
The shift toward passive investment strategies has been gaining momentum since the 2008 financial crisis as investors sought shelter from the economic storm and were drawn to the funds’ lower fees and turnover. In 2023, the combined assets of U.S.-domiciled passive mutual funds and exchange-traded funds (ETFs) surpassed the assets of active mutual funds and ETFs.
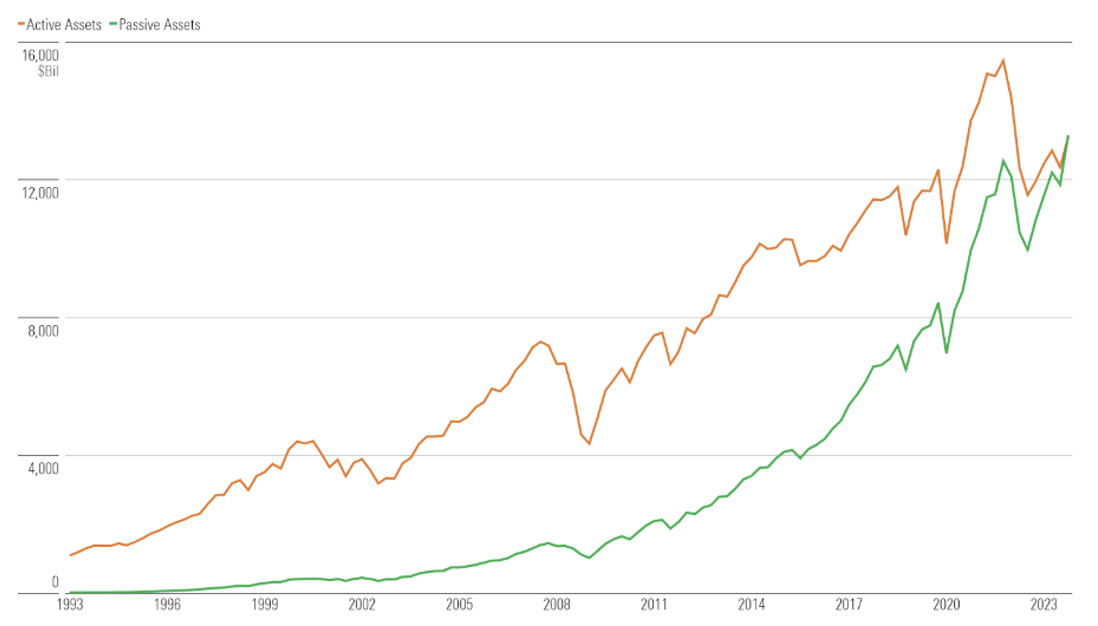
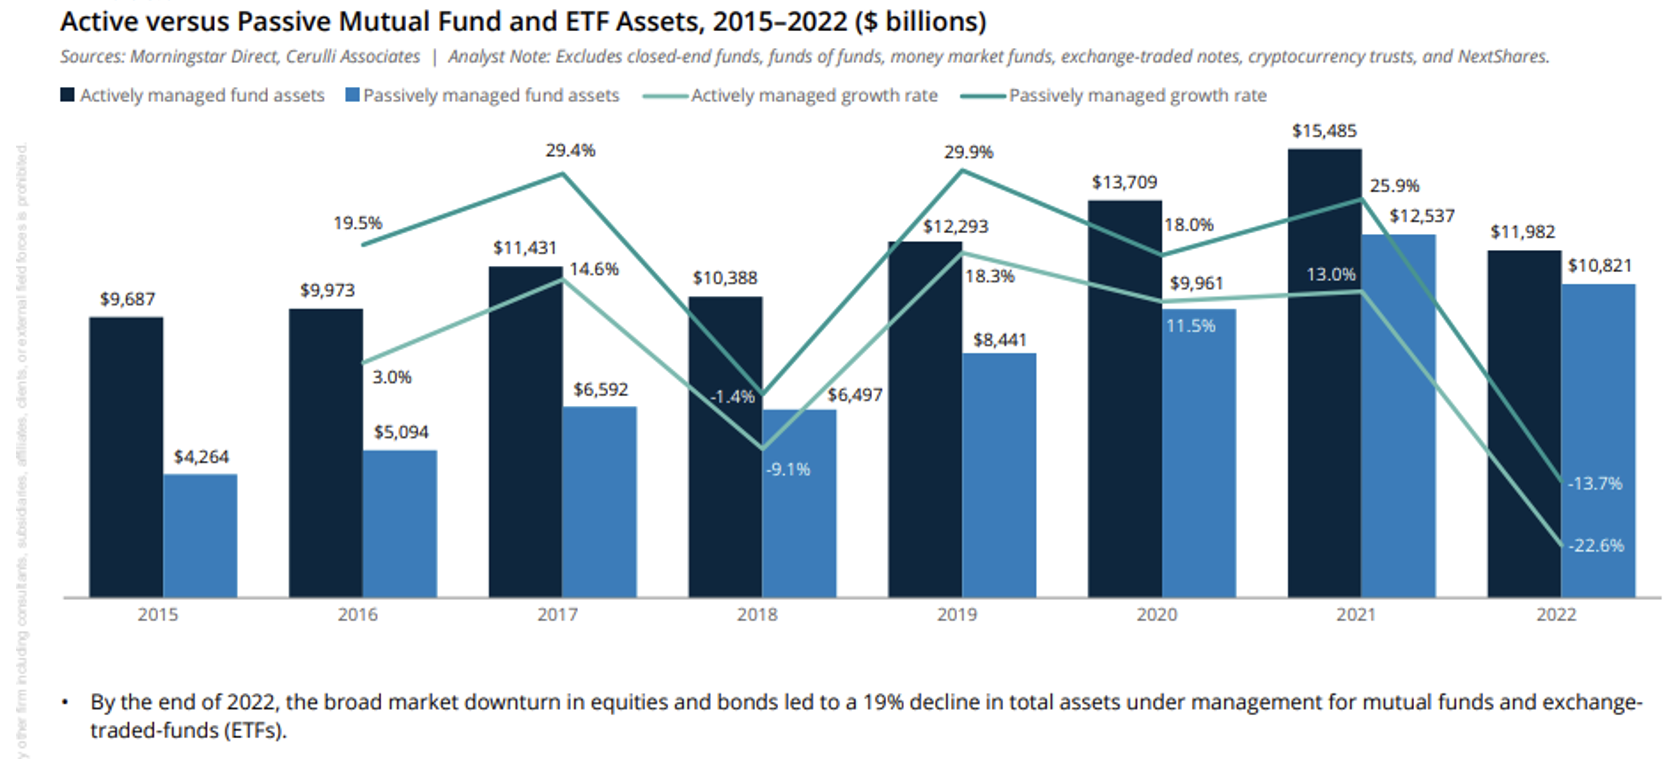
This is a milestone that industry watchers have been tracking for several years, as passively managed ETFs and mutual funds grew from a mere 31% of the total U.S. fund assets in 2015 to just over 50% as of the end of 2023.
The tipping point in 2023 towards passively managed strategies was due in part from strong returns in U.S. equity large cap, as measured by the returns of the S&P 500 Index surpassing 26% during the year. Returns stemming from the “Magnificent Seven” stocks were key drivers propelling U.S. large cap benchmarks in 2023, with the seven stocks combined climbing 75.71% during the year.
Not surprisingly, the U.S. large cap equity market has made it challenging for active managers to succeed over the long run, according to Morningstar (Source: Morningstar’s U.S. Active/Passive Barometer Year-End 2023). In 2023, active large blend managers had a 46.8% success rate over passive strategies, but over the past decade, only 12% of them survived and outperformed their average passive counterpart. Morningstar defines success rates as the percentage of actively managed funds that survive, rather than being closed or merged into another fund, and generate higher returns than their passive counterparts in the same period. Furthermore, Morningstar reports:
• Active U.S. small cap blended strategies in 2023 saw a 57% success rate versus their passive counterparts for the year with a 26% success rate over the past decade.
• Foreign large blend equity strategies experienced a 46% success rate versus passive peers in 2023, with a similar 25% success rate over the past decade.
• Foreign small-mid blend strategies saw a strong 62% success rate in 2023 and a 28% success rate over the past decade.
• Diversified emerging market strategies experienced a 45% success rate for active strategies in 2023 and 26% success rate over the past 10 years.
• U.S. real estate saw a 43% success rate in 2023 and a 52% success rate over the past decade, while global real estate experienced a robust 71% success in 2023 and a 51% success rate over the past decade.
It is important to note that performance measures include a cost component as they are measured on a net-of-fee basis. Given that active strategies generally have a higher management fee, a component of the underperformance versus the benchmark is the investment fee impact. If fees associated with an actively managed investment are high, it is more difficult for a portfolio to outperform a benchmark and therefore could result in lower returns.
Broader Trends In Passive Investing
Equity strategies aside, in 2023, nearly 53% of active bond managers outperformed their passive peers, a significant improvement from 2020 when only 30% of them managed to outperform. However, recent research by S&P Global suggests that fixed income indexing, despite a later start than its passive equity counterparts, has a higher growth rate than equity strategies and the potential for wider adoption through time based on changes to benchmark methodology and continued trading efficiencies that may help promote growth in indexed fixed income. In 2023, intermediate core bond active strategies had a 57% success rate versus passive peers, but a 34% success rate over the past decade.
Moving beyond U.S. mutual funds and ETFs, one area in passively managed strategies that appears to have the potential for future growth is the retail separately managed account segment. Managed account assets, which encompass vehicles ranging from separately managed accounts (SMAs) to unified managed account programs had assets of $9.6 trillion as of the end of 2022 and Cerulli further predicts a 13.1% growth rate to predicted assets of $15.6 trillion by 2026 (Source: The Cerulli Report: U.S. Managed Accounts 2023). Direct indexing strategies are an important and growing category within this segment as direct indexing currently makes up approximately 32% of all manager-traded assets. Direct indexing assets were $434 billion at the end of 2022, with an expected growth rate of 12% over the next four years, outpacing the growth of both mutual funds and ETFs over the same period.
Direct Indexing: What It Is And Why It’s Expected To Grow
Direct indexing is the intersection of a passive and tax-aware strategy tailored for a specific client.
Direct indexing SMAs are manager-traded separate accounts that share three important characteristics:
• A focus on passive returns. Direct indexing is a passive investment solution that can be customized. In the case of equity direct indexing, this means the portfolio tracks an index, such as the S&P 500 Index or a blended index. In the case of fixed income, the portfolio typically consists of a bond ladder—buying bonds with differing maturities in the same portfolio. Direct index portfolios typically do not have excess returns as their primary investment objective. Their primary objective is often beta exposure.
• Personalization. Direct index solutions allow for some type of customization, usually for taxes, but also for factors such as environmental, social and governance (ESG) characteristics.
• Tracking error management. Providers of direct indexing solutions use algorithmic processes designed to minimize the tracking error of the portfolio with respect to an index while implementing the custom tax or ESG options desired by the client. In our view, technology is crucial to making this happen.
Potential Tax Advantages Of Direct Indexing
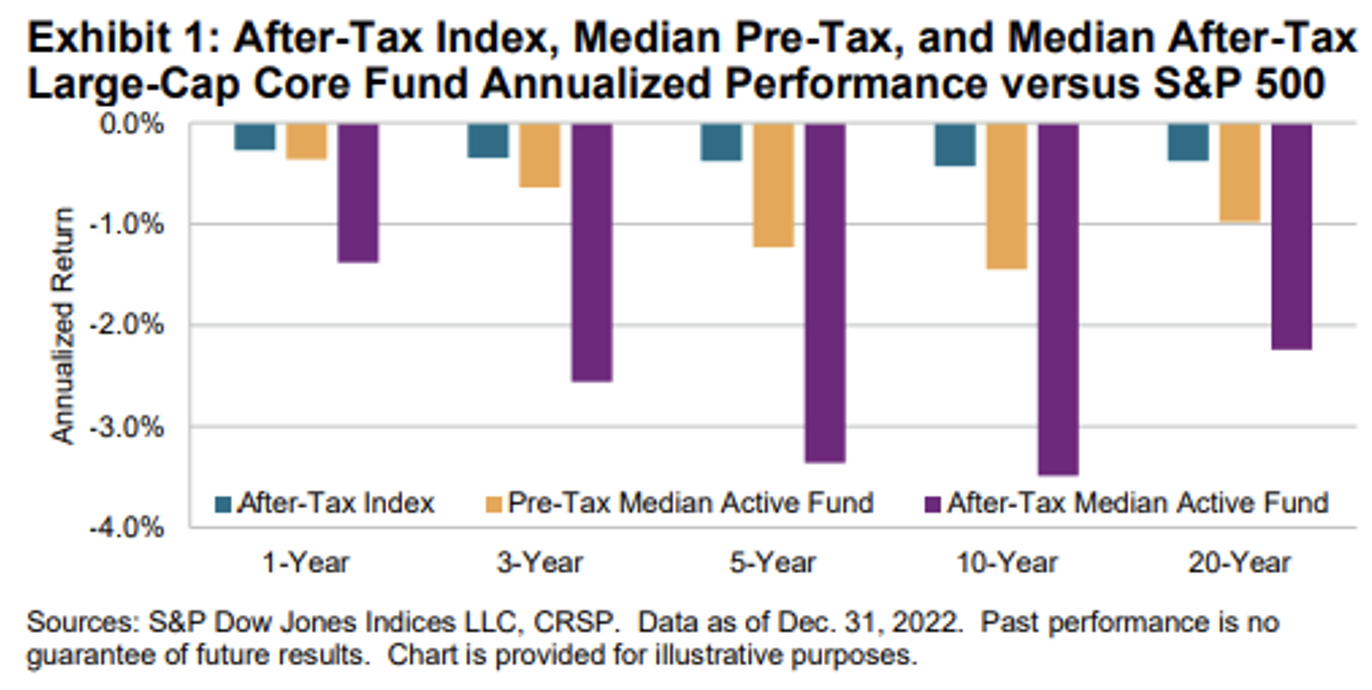
According to recent research from SPIVA, on an after-tax basis, the median active fund trailed the S&P 500 over every time horizon by up to 3.5% annually. (After-tax index performance is calculated using historically applicable qualified dividend tax rates applied to historical index dividends on a daily basis, assuming immediate reinvestment of the remaining amounts. State and local tax liabilities, alternative minimum tax or phaseouts of certain tax credits, exemptions, and other deductions are excluded.)
By contrast, research suggests the potential “tax alpha” within a direct indexing portfolio can range between 85 basis points to 1.10% per year on a portfolio benchmarked to the S&P 500 (Source: Chaudhuri, Shomesh and Burnham, Terence C. and Lo, Andrew W., An Empirical Evaluation of Tax-Loss Harvesting Alpha [March 5, 2019]).
Trend Towards Customization
Underpinning some of the growth potential within direct indexing are the enhanced technology capabilities that give these strategies the ability to customize for the end client—an important way to personalize an offering to allow an advisor to differentiate in the marketplace. Through direct indexing, advisors have an ability to customize, or tilt, portfolios based on investment objectives and factors such as value, momentum and minimal volatility.
We don’t foresee a world in which actively managed strategies disappear. In fact, actively managed ETF launches are on the rise. According to Morningstar, actively managed ETFs have experienced an organic growth rate of more than 30% since 2018. The year 2023 saw the ETF industry barrel past the previous record for the number of launches in a calendar year, with 543 new ETFs hitting the market. Roughly 75% of the funds that launched this year are actively managed, Morningstar reports. While it is still the early days for active ETFs, the assets under management (AUM) and launch growth suggest that buyers may prefer the ETF vehicle to a comparable mutual fund for an active strategy.
The shift to passively managed strategies and demand for tailored solutions are top priorities for some investment managers. Mellon—one of the world’s largest and longest-running index management firms—and BNY Mellon’s Pershing X have broadened the approach to applying an “active mindset to passive investing” by offering advisors direct indexing solutions at scale to deliver tax-efficient, customized beta exposure to their clients. The future of investment management, it seems, may not be about choosing passive or active, but rather how to make room for both.
Stephanie Hill is head of index at Mellon Investments Corp.