


There are two things to take from this chart. First, after recovering from the pullback at the start of the year, valuations are nearing the levels of 2007–2008 and 2015, when previous drawdowns started. Second, even at the bottom of the recent pullback, valuations were still at levels above any point since the crisis and well above levels before the late 1990s.
Although they are close to their highest levels over the past 10 years, valuations remain below the 2000 peak, so you might argue that this metric does not suggest an immediate risk. Of course, that assumes we might head back to 2000 bubble conditions, which isn’t exactly reassuring. In conclusion, risk levels remain high, although not immediate.
Risk factor #2: Changes in valuation levels
As good as the Shiller P/E ratio is as a risk indicator, it’s a terrible timing indicator. One way to determine whether risks are immediate or not is to look at changes in valuation levels over time instead of absolute levels.
From this chart, you can see that when valuations roll over, with the change dropping below zero over a 10-month or 200-day period, the market itself typically drops shortly thereafter. With the recent recovery, we’ve moved back out of the trouble zone, and although the trend has turned negative again, we are still in positive territory. Although risks remain, they may not be immediate. Still, this metric will bear watching.
Risk factor #3: Margin debt
Another indicator of potential trouble is margin debt.
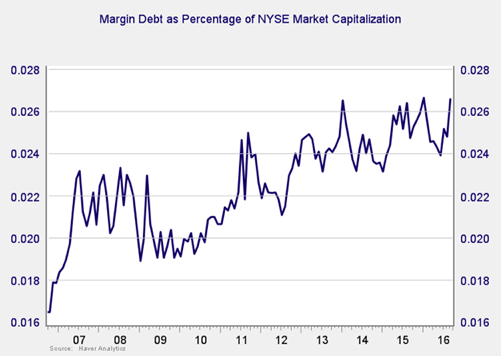
After declining at the start of the year due to the recovery from the pullback, debt levels have climbed in the past several months, back to the highest level since the financial crisis. This kind of increase suggests that risk levels are rising once again, and they certainly remain high by historical standards. Again, however, I don’t think this is necessarily an immediate risk, but we need to keep our eyes open.
Risk factor #4: Changes in margin debt
Consistent with this, if we look at the change in margin debt over time, spikes in debt levels typically precede a drawdown. With the absolute risk level high, the immediate risk level is also rising: the change in debt indicator is approaching, but not yet at, the 10-percent annual increase that suggests risk is has become more immediate.
